The Numbers
Given all the noise about immigration in the US, one might think there has been major change over the last few decades. There hasn’t been. Here are the numbers of authorized permanent residents allowed into the US by year since 1900 as a percent of the population:
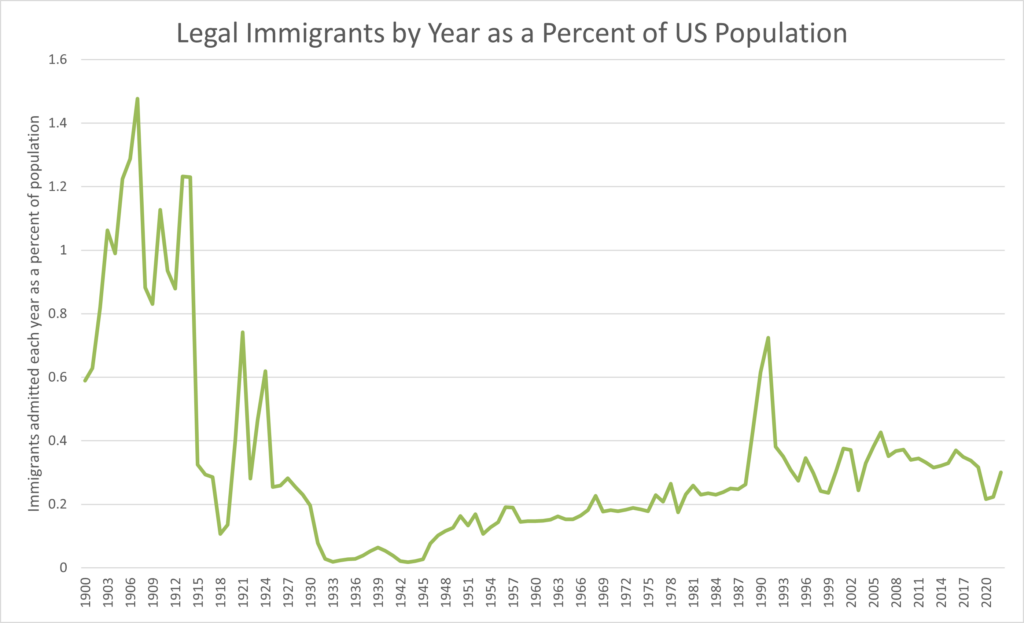
Figure 57: Legal Permanent Residents Accepted by Year as Percent of Population 1900-2022. Source: Migration Policy Institute Data Hub tabulation of Department of Homeland Security data. WW105
From the time of European settlement until after the civil war, there was no restriction on the number of immigrants to the US, in fact the country sought to encourage European immigration. In the 1880’s the US passed legislation excluding the Chinese, who had been actively sought as workers on the transcontinental railroad a couple of decades earlier. The 1880’s also allowed for the exclusion of immigrants “likely to become a public charge”. In the early 1900’s, as the chart shows, there was a large influx of immigrants, many from southern Italy. In the 1920’s, after World War I, a quota system was implemented which severely restricted the number of immigrants and favored immigrants from certain countries, mostly Northern and Western European ones, and limited immigration from Southern and Eastern Europe, Asia, and Africa. Given the unemployment of the Great Depression, anti-immigrant sentiment ran high.
In 1965 Congress passed the Immigration and Nationality Act (aka the Hart-Celler Act) which scrapped the former country-based quotas. The bill was passed with bipartisan support from Republicans and Northern Democrats and opposed by Southern Democrats who at that time represented the racist South.
The Hart-Celler Act set the main principles for immigration regulation still enforced today. It applied a system of preferences for family reunification (75 percent), employment (20 percent), and refugees (5 percent) and for the first time capped immigration from within the Americas[1]. This act was tweaked twice by Congress, first in 1986, under Reagan, to increase enforcement including fines for employers who hired illegal immigrants as well as providing amnesty for unauthorized immigrants (hence the spike on the chart above shortly after), and in 1990, under HW Bush, to increase the total number of immigrants allowed, and increase the number of visas for professionals. It is important to understand that immigration numbers are, and have been, determined by law through these Acts of Congress. If an immigrant meets the requirements set in these acts, they have to be admitted. Simply put, it’s the law and only Congress can amend it.
As the chart above shows, currently authorized immigration into the US is about 0.4% the size of the US population, or roughly one million people a year. The chart below shows the breakdown since 2012:
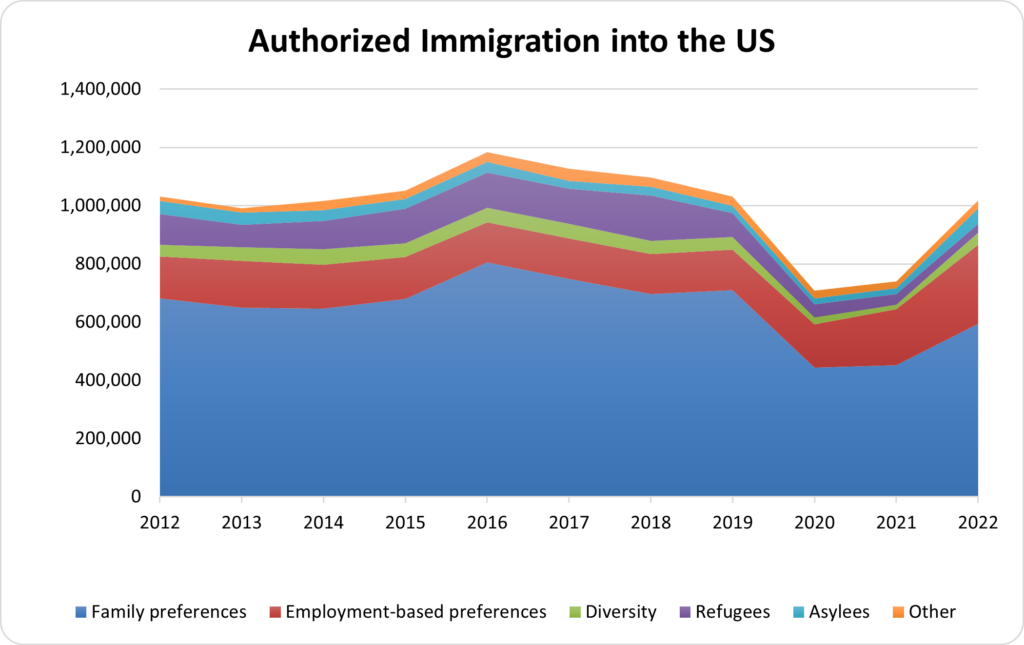
Figure 58: New Permanent Residents by Class of Admission. Source: Department of Homeland Security Office of Immigration Statistics. WW106
Several things are clear from this chart. Family and employment preferences account for the vast majority of permanent residents admitted while refugees (who apply from outside the US) and asylum seekers (who apply from inside the US) are a small fraction of those admitted. It is also evident from both the long term and short-term charts that immigration is hardly affected by which political party holds sway. The chart also helps explain why immigrants fall disproportionately into high skilled and low skilled groups. The roughly 140,000 immigrants admitted annually under employment preferences, many of them graduates of US universities, are by definition highly skilled. Immigrants accepted under family preferences often fall at the lower end of the “skills” continuum, at least as measured by years of education.
To recap, the US accepts about a million authorized immigrants a year in accordance with rules enacted by Congress in 1965 and amended in 1986 and 1990. These immigrants are accepted under family and employment-based preferences, a small percentage of immigrants are refugees and asylum seekers.
In addition to Lawful Permanent Residents admitted, there is a much larger flow in and out of non-immigrants which includes tourists and business travelers (70,056,257 admissions in 2017), students (1,845,739 admissions in 2017), and temporary workers (3,969,276 in 2017)[2]. It should be noted that these are total admissions, and, in many cases, the same individual will cross the border several times in one year[3]. The tourists and business travelers are a major boost to the US economy, in fact our trade surplus in services is partly due to foreign tourists spending more here than US tourists spend abroad. There are also unauthorized immigrants, both those that manage to cross undetected at the southern border and a larger group that overstays visas. While it is difficult, for obvious reasons, to get exact numbers for the flow of these unauthorized immigrants, the Department of Homeland Security estimates that the illegal immigrant population increased by 470,000 per year from 2000 to 2007, but only by 70,000 per year from 2010 to 2015. Currently, there are about 11 million unauthorized immigrants in the US, the majority of them here for over 10 years[4]. The total immigrant population currently stands at around 46 million, which is around 14% of the total population, having risen from 11.1% in 2000 and a low of 4.7% in 1970. This is near a historic high as shown in the chart below. The US has the highest number of immigrants of any country in the world, although not the highest percentage at 14%.Other countries with high immigrant percentages include Saudi Arabia (39%), Australia (30%), Canada (21%), Sweden (20%), Germany (19%), and Ireland (18%)[5].
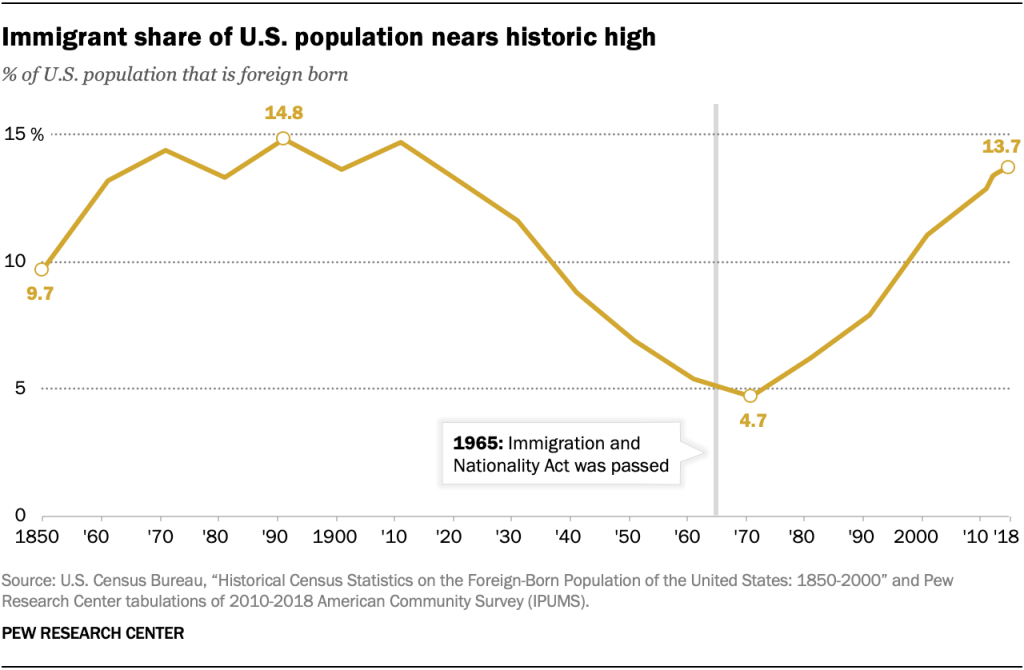
Figure 59: Immigrant Share of US Population. Graphic: PEW Research Center https://www.california-mexicocenter.org/key-findings-about-u-s-immigrants-pew-research-center/. WW184
Authorized (and as shown below, unauthorized) permanent residents, as well as guest workers, are considered essential by US business and farm interests. To quote from the US Chamber of Commerce recently:
American employers of all sizes and across a host of industries are facing chronic workforce shortages that significantly limit the ability of their businesses to grow. The vast shortcomings of our legal immigration system are a key contributing factor as to why companies are struggling to hire and retain the talent they need to succeed in an increasingly competitive global marketplace. As demand for workers has increased in recent years, the outdated and arbitrarily low visa quotas, onerous compliance burdens, decades-long backlogs, and obsolete eligibility requirements that pervade employment-based visa programs leave many companies out in the cold when it comes to adequately meeting their workforce needs[6].
The American Farm Bureau Federation also calls for immigration reform, to increase the number of farm workers, noting:
The impacts of an enforcement only approach to immigration would be detrimental to the agricultural industry. If agriculture were to lose access to all undocumented workers, agricultural output would fall by $30 to $60 billion….
Many migrants who begin their careers as farm laborers move onto other sectors of the economy or less demanding positions after several years. This progression leads to farmers often being the first to bear the negative economic impacts of decreased border crossings and migrant labor shortages[7].
These quotes are a clue to the confused politics of immigration in the US. Business and large-scale farming have traditionally been associated with the Republican party and they call for more foreign workers to be let in, both as immigrants and temporary workers. On the other hand, the more recent populist wing of the Republican party is generally associated with anti-immigration sentiment. The Democratic party is also somewhat conflicted. Traditionally, the Democratic party represents labor, and labor unions have often favored limiting immigration to protect domestic workers. Progressive Democrats are concerned with humane treatment of immigrants and pathways to citizenship for long term unauthorized immigrants and their children.
In short, US immigration quotas are set by law, and building a wall on the southern border won’t do much when the large majority of immigrants and temporary workers are authorized (i.e. “legal”), and most of the unauthorized immigrants are overstaying valid visas. There have been several attempts in Congress to overhaul immigration policies, but these have gone nowhere, which is not surprising given the business interest in, and agricultural need for, foreign workers.
As mentioned, a small percent of immigrants is let in as refugees or asylum seekers, but even a low chance of entry is worth the risk for many who are desperate to escape real persecution and crime, or who in fact come as economic migrants. This has resulted in much publicized issues at the southern border. However, in accordance with US laws and quotas, few of these migrants are actually admitted as permanent residents[8].
| The US Migrant Surge of 2022-2023 The number of legal permanent residents accepted into the US has hardly changed over the last 30 years. 1,090,172 new permanent residents were accepted in 1989 and 1,018,349 were admitted in 2022, with the average being almost exactly one million per year, including during the Trump administration (see Figure 58). Recently there has been a much-reported surge in migrants seeking entry into the US. Please refer to the footnotes for a number of good “explainers” which detail the who and why of this surge and how it is being handled. What follows is a very brief overview of this complicated subject. The section of US law that deals with immigration is Title 8. During COVID a provision of the Public Health Service Act of 1944, Title 42, was used to summarily deny entry to immigrants during the “health emergency”, including migrants applying for asylum[9]. The COVID “health emergency” was declared over in May of 2023 and Title 42 could no longer be used to circumvent the provisions of Title 8. The surge started in 2021, two years before the end of Title 42[10]. What is causing it? Several factors are “pushing” and “pulling” migrants to attempt entry into the US both at official border crossings (legal attempts at entry), and by illegally crossing between points of entry. The US Customs and Border Protection (CBP) is tasked with intercepting illegal border crossings and refers to such interceptions as “encounters”[11]. Until fiscal year 2021, most illegal crossings were by migrants from Mexico, El Salvador, Guatemala, and Honduras, but in the last couple of years these migrants have been joined by large numbers from Venezuela, Nicaragua, and Cuba. Migrants are “pushed” by conditions in their home countries. All these countries except Mexico are very poor. The Central American countries of El Salvador, Guatemala, and Honduras, have, in addition to poverty and hunger, extremely high murder rates fueled by gang violence, political corruption and instability. Back-to-back major hurricanes in 2020 fueled food insecurity, and climate change is expected to add further to economic declines in future[12]. The “pull” factors to the migrant surge include the booming job market in the US after the end of COVID. A second pull factor is a 2022-2023 “parole” program that accepts up to 30,000 Venezuelans, Nicaraguans, Cubans, and Haitians a month into the US for up to two years provided they have a sponsor here. People accepted into this program can fly directly to the US avoiding the pile up at the border[13]. Why these countries? Like the Central American countries these are economic basket cases, but the US has embargoes against all of these countries, except Haiti, which has made conditions worse, and naturally has made these countries less likely to accept back refugees. These embargoes are a political holdover from the cold war, all three were “leftist” even if they are just dictatorships now. Removing the embargoes would help ease conditions and allow more repatriation of refugees. The murder rate per 100,000 in Cuba is 4.2 compared to 7.4 in Florida, and 17.3 in Guatemala. The reimposition of sanctions against Cuba in 2017 is a direct driver of the flow of what are basically economic migrants from that country now[14]. It should be noted that neither parole nor applications for refugee status and asylum have led to a significant increase in migrants accepted for legal permanent residence, but none-the-less such migrants have to be treated according to the laws of the country. The surge has caused overloading of the systems in place to deal with migrants. The laws regarding migrants were put in place by Presidents and Congresses of both parties and need to be updated in a bi-partisan manner. One final note is that the US is far from the only country with a surge in migrants. Seven million Venezuelans have left their country since 2015, mostly settling in nearby countries much poorer than the US. Canada has also experienced a surge in migrants, and Mexico has to deal with the huge wave of migrants not accepted into the US. European countries also have to deal with large waves of migrants from the Middle East, Africa, and Ukraine. The best way to reduce migration is to reduce the wars and economic collapses that foment it. |
Economic Effects in the US
Immigration, like trade, can hurt certain groups of domestic workers as we saw in the primer. One example is provided by the meat packing industry in the US. More than a century ago, Sinclair Lewis wrote “The Jungle” about the Chicago meat packing industry, which at that time was dangerous and dirty and largely conducted by immigrants. Over time, the meat packers unionized and, as noted by Eric Shloser in an article in the Atlantic, “by the early 1970s, a job at a meatpacking plant offered stable employment, high wages, good benefits, and the promise of a middle-class life.”[15] Eric goes on the describe what happened next:
As I described in my book Fast Food Nation, published in 2001, the largest companies in the beef industry had recruited immigrants in Mexico, brought them to the meatpacking communities of the American West and Midwest, and used them during the Ronald Reagan era to break unions. Wages were soon cut by as much as 50 percent. Line speeds were increased, government oversight was reduced, and injured workers were once again forced to remain on the job or get fired.
The same thing happened in poultry processing. In December 2001, the New York Times reported that:
The government charged the company (Tyson Foods Inc.) and six of its employees with conspiring to transport illegal immigrants across the Mexican border and help them get counterfeit work papers for jobs at more than a dozen Tyson poultry plants. The indictment said that, to meet production and profit goals, Tyson officials would contact local smugglers near its plants to get more workers[16].
Clearly the domestic workers in the unionized meat packing industry were hurt by this exploitation of immigrants.
As in trade, however, one also has to look at the flip side: meat prices were almost certainly lowered for consumers, who could as a result afford more beef and chicken. In the case of trade, we wanted to see if trade increased the average productivity of workers as predicted by comparative advantage. With immigration we can ask the same thing. If average productivity increases as a result of immigration, then on average we are better off because we produce more stuff per person than we would if immigration had not occurred, and vice versa. Unfortunately, it is very difficult to isolate the productivity contribution of “immigrants” which are a diverse group which changes over time and includes both workers with little education, and high skilled workers here under different immigration preferences. To quote the National Academies of Sciences 2017 book “The Economic and Fiscal Consequences of Immigration” which is an excellent review of the literature:
The effects of immigration have to be isolated from innumerable, simultaneously occurring influences that shape local and national economies. Beyond this measurement challenge, the relation between immigration labor inflows and market outcomes is not a constant; it varies across places and immigration episodes, reflecting the skill set of incoming immigrants and natives in destination locales, a given market’s mix of industries, the spatial and temporal mobility of capital and other inputs, and the overall state of the economy[17].
While some economists argue on theoretical grounds that “low skilled” immigrants will hurt overall productivity, much depends on whether new immigrants take jobs that complement or compete with jobs held by people already in the country, be they earlier foreign-born immigrants themselves (as we or our forebears all were at some point) or native born. It is also important to remember that over time immigrant families, especially the children, become “just like everyone else” economically and the economy simply expands, so any productivity and wage effects of immigration are limited to the continuing flow of new immigrants.
Despite the difficulties, economists have conducted statistical studies to try to quantify the effect of immigration, diverse as it is, on productivity, wages, employment, growth, and government spending.
Sorting the results from those with the most consensus to those with the least:
Immigration has not negatively affected overall employment levels[18]. Now, in early 2023, there is in fact a worker shortage in the US. As we have seen, business and farm interests are begging for more workers. The country is having a hard time finding workers for specific low pay occupations such as health aides and farm workers.
Immigration has caused overall GDP growth. No surprise here, more workers result in more output, as well as more consumption. In fact, without continued immigration, the US population would start falling, and GDP might very well stagnate or shrink. As explained later, this is because the native birth rate in the US, at 1.7 children per woman, is below the replacement rate of 2.1 children per woman, as indeed it is in most advanced economy countries. While overall GDP grows with immigration, that doesn’t tell us anything about per-capita GDP which determines average income, it just says total output is higher. One estimate is that immigrants increased GDP by $2.3 trillion in 2017[19].
Immigration has had little effect on wages for most “native born” workers, but probably has a negative ongoing impact on specific groups of native-born and prior immigrants with less education. Most of the studies of the effect of immigration on wages have looked at what are referred to as “low skilled”[20] workers. Since there is no way to know what wages would have been in the absence of immigration for various groups of workers, economists use a variety of techniques to try to identify any immigration related wage effects. All of these techniques have their difficulties as the National Academies of Sciences review points out in considerable detail, and results vary considerably from study to study[21]. We will quote from that book’s conclusion:
When measured over a period of more than 10 years, the impact of immigration on the wages of natives overall is very small. However, estimates for subgroups span a comparatively wider range, indicating a revised and somewhat more detailed understanding of the wage impact of immigration since the 1990s. To the extent that negative wage effects are found, prior immigrants—who are often the closest substitutes for new immigrants—are most likely to experience them, followed by native-born high school dropouts, who share job qualifications similar to the large share of low-skilled [fewer years of school] workers among immigrants to the United States [22]
Regarding the less studied effects of high-skilled [more years of school] immigration (recall that immigrants tend to fall disproportionately into low and high skilled extremes) the book concludes:
Several studies have found a positive impact of skilled [more years of school] immigration on the wages and employment of both college-educated and non-college-educated natives. Such findings are consistent with the view that skilled immigrants are often complementary to native-born workers, especially those who are skilled; that spillovers of wage-enhancing knowledge and skills occur as a result of interactions among workers; and that skilled immigrants innovate sufficiently to raise overall productivity. However, other studies examining the earnings or productivity prevailing in narrowly defined fields find that high-skilled immigration can have adverse effects on the wages or productivity of natives working in those fields.[23]
In short, workers, both native born and earlier immigrants, in occupations where new immigrants are competitive, can see wages suppressed somewhat. The wage suppression that econometric studies have calculated range from a reduction of 1.4% to a wage increase of .3% for each additional 1% inflow of immigrants. These studies, and the wage impacts they calculate, are almost all limited to the effect on native high school dropouts or specific skills, and often just men[24]. Estimates of the wage effects of immigrants with high levels of education are few and far between and the literature usually focuses on the benefits to the larger economy of such immigrants.
Table 17: Percent of the US workforce that were immigrants in 2012. shows the percent of immigrant workers in major occupations. It is clear that some occupations rely pretty heavily on immigrant labor.
Table 18: Percent of the US workforce that were immigrants in 2012.
| Occupation | Share foreign born in 2012 |
| Across All Occupations | 15.8% |
| High-level professionals | 19.4% |
| Professionals | 11.8% |
| Managers | 10.5% |
| Sale workers | 11.6% |
| Service workers | 26.9% |
| Farmers and farm laborers | 32.6% |
| Skilled workers | 22.7% |
| Unskilled workers | 29.0% |
Table Notes: Overall, 15.8% of workers are foreign born, so immigrants tend to cluster in occupations with percentages higher than that. In this listing “skilled workers” are classified by occupation rather than years of schooling. For example, carpenters and construction workers are classified as skilled, textile machine and metal workers as unskilled.
Source: National Academies of Science, 2017, Page 97, Table 3-2
It is clear from this table why the American Farm Bureau values immigrants.
Effects of Immigrants on Government Spending
In addition to the effect of immigrants on wages,economists have also debated whether immigrants are a net positive or negative in terms of government spending. Again, the answer is difficult because it requires aggregating across a varied group of immigrants. Highly educated immigrants bring a large financial benefit since they hold jobs that pay well and contribute much more to taxes than they consume in benefits. Even a 21-year-old immigrant with a high school diploma brings a net 6 figure fiscal benefit to the country over their lifetime[25]. However, many immigrants are older, less educated, and poorer. To quote from the National Academies of Science study:
An immigrant and a native-born person with similar characteristics will likely have about the same fiscal impact. Persons with higher levels of education contribute more positively to government finances regardless of their generational status. Furthermore, within age and education categories, immigrants generally have a more salutary effect on budgets because they are disqualified from some benefit programs and because their children tend to have higher levels of education, earnings, and tax paying than the children of similar third-plus generation adults[26].
Looking in detail at the years 2011-2013, the study finds that, for that two-year sample period:
the net cost to state and local budgets of first generation adults (including those generated by their dependent children) is, on average, about $1,600 each. In contrast, second and third-plus generation adults (again, with the costs of their dependents rolled in) create a net positive of about $1,700 and $1,300 each, respectively, to state and local budgets. These estimates imply that the total annual fiscal impact of first-generation adults and their dependents, averaged across 2011-2013, is a cost of $57.4 billion, while second and third-plus generation adults create a benefit of $30.5 billion and $223.8 billion, respectively. By the second generation, descendants of immigrants are a net positive for the states as a whole, in large part because they have fewer children on average than do first generation adults and contribute more in tax revenues than they cost in terms of program expenditures.[27]
Finally, looking at all levels of government, the study concludes:
Viewed over a long time horizon (75 years in our estimates), the fiscal impacts of immigrants are generally positive at the federal level and negative at the state and local levels. State and local governments bear the burden of providing education benefits to young immigrants and to the children of immigrants, but their methods of taxation recoup relatively little of the later contributions from the resulting educated taxpayers. Federal benefits, in contrast, are largely provided to the elderly, so the relative youthfulness of arriving immigrants means that they tend to be beneficial to federal finances in the short term. In addition, federal taxes are more strongly progressive, drawing more contributions from the most highly educated. [28]
To summarize, on average, first generation immigrants are more costly to governments, mainly at the state and local levels, than are the native-born generations[29].
The Productivity Impact of Immigrants
There has been a lot of research into the productivity impacts of highly educated immigrants, however quantifying the impact is not as easy as pointing out that it is likely to be positive. For example, the foreign-born account for 50 percent of those with doctoral degrees working in mathematics and computer science occupations, and other research has estimated that scientists and engineers are responsible for a large fraction of the productivity gains in recent years[30].
There have not been many attempts to directly quantify the overall productivity impact of immigrants, and these have had mixed results. A lot depends on whether such immigrants’ skills are complementary or competitive with the mix of skills already in the country, and there is conflicting research on that score. However, if you ask a farmer who needs to get his crop picked whether immigrants improve his productivity, the answer would probably be yes.
It is interesting to look at the states that have the most immigrants both in absolute terms and as a percent of their populations.
The states with the top immigrant populations, including California, Texas, Florida, New York, and New Jersey, are hardly economic basket cases. In fact, a simple static correlation between the percent of immigrants in the state’s population and the wealth of the state in Gross State Product (GSP) per worker[31] is significantly positive as shown in this scatter graph.
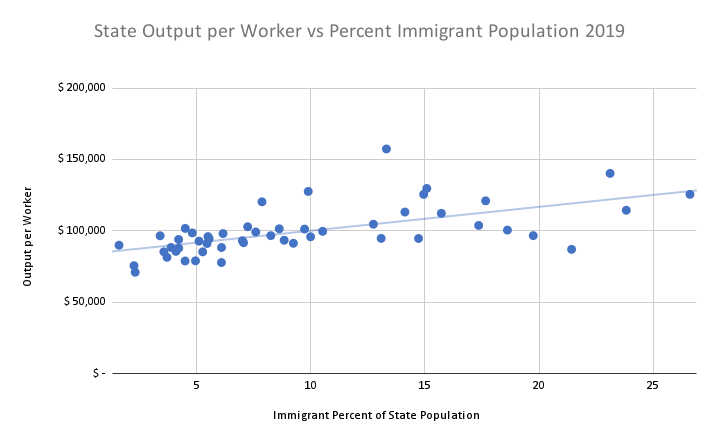
Figure 60: Output Per Worker vs Immigrant Percent. The 50 states and District of Columbia (dots) graphed by percentage of immigrants in their population and output per worker (employees and proprietors). The trend line is positive, meaning higher immigrant states have higher output per worker with a high degree of probability this association is not due to chance. California is furthest right; the highest dot is the District of Columbia. Sources: BEA and Census Bureau. WW185
Of course, one can’t infer causality from this relationship since immigrants tend to settle where job opportunities are good, and the economy is booming. Economists have tried to determine if immigration (in the US, with our particular set of immigrants, over a specific interval of time) “causes” economic growth. They do this by trying to account for all the other factors that might cause growth and then see if there is a remaining correlation between growth of the immigrant population and growth in gross state product per capita. As can be imagined, this is a tall order, and like most econometric models, results vary depending on the explanatory variables chosen and assumptions made. The results are a mixed bag, with some showing a positive impact on productivity and others no significant impact[32].
California, the state with most immigrants, has about ten million or 26% of the population of the state, and almost a quarter of all the immigrants in the US[33]. In addition, there are another seven million younger native-born citizens in California who have one or both immigrant parents.
In California, 87% of the graders and sorters of agricultural products, 76% of the first-line supervisors of farming, fishing, and forestry workers, and 79% of other agricultural workers are immigrants. Eighty three percent of manicurists and pedicurists are immigrants, as are 81% of the sewing machine operators. These are all low paid jobs, and so statistically they reduce output per worker, but someone has to pick and sort the crops. This type of work tends to be complementary to the work done by the native born and earlier immigrants, which allows more of the latter to pursue better paid, and more economically productive work. At the other end of the spectrum, immigrants in California fill 39% of science, technology, engineering, and math jobs, and are well represented among Silicon Valley entrepreneurs[34]. In short, the overall impact on productivity change from immigration is unclear but economists’ best efforts indicate it is either neutral or somewhat positive.
Before we leave the subject of immigration’s effects on productivity, we should note that the discussion so far has been strictly from the internal perspective of the United States. From a world perspective, when an immigrant moves from a low productivity country to a high one such as the US, their productivity can increase enormously. When we look at the global picture later, we will see that migration can help speed up productivity gains worldwide. Of course, when an immigrant goes from picking fruit or providing manicures in a poorer country to picking fruit or providing manicures in a richer one, their productivity may actually not increase much, although they may later move up the productivity ladder more easily in the rich country.
Other Economic Impacts of immigration in the US
Immigrants concentrate in what are referred to as gateway cities. Major concentrations of immigrants are found in Miami, New York, and Los Angeles, and lower concentrations in Houston, San Francisco, Boston and Chicago and many smaller cities[35]. The literature has found a positive correlation between immigrant populations and housing costs[36], but it is difficult to quantify this relationship because many gateway cities have thriving economies that would in any case result in high demand and prices. Of course, rising housing prices benefit homeowners and landlords in these cities, which tends to increase inequality.
Increases in the share of low-skilled immigrants in the labor force appear to have reduced, over time, the prices of immigrant-intensive services such as childcare, eating out, house cleaning and repair, landscaping and gardening, taxi rides, and construction[37]. This also has implications for income inequality, but clearly benefits anyone who uses these services.
And, finally, since immigrants fall into the “tails” of the education distribution, and education correlates strongly with income, immigration tends to increase income inequality. However, if we remember that this applies to first generation immigrants, and even among those, earnings increase over time, the effect is not large compared to other causes of growing income inequality. One study found that immigration contributed 5% to the growth of inequality between 1980 and 2000[38].
US Immigrant Demographics
Where do immigrants live in the United States? We’ve already mentioned that about one quarter of all immigrants live in California, the chart below shows the immigration population and its share of the state’s population.
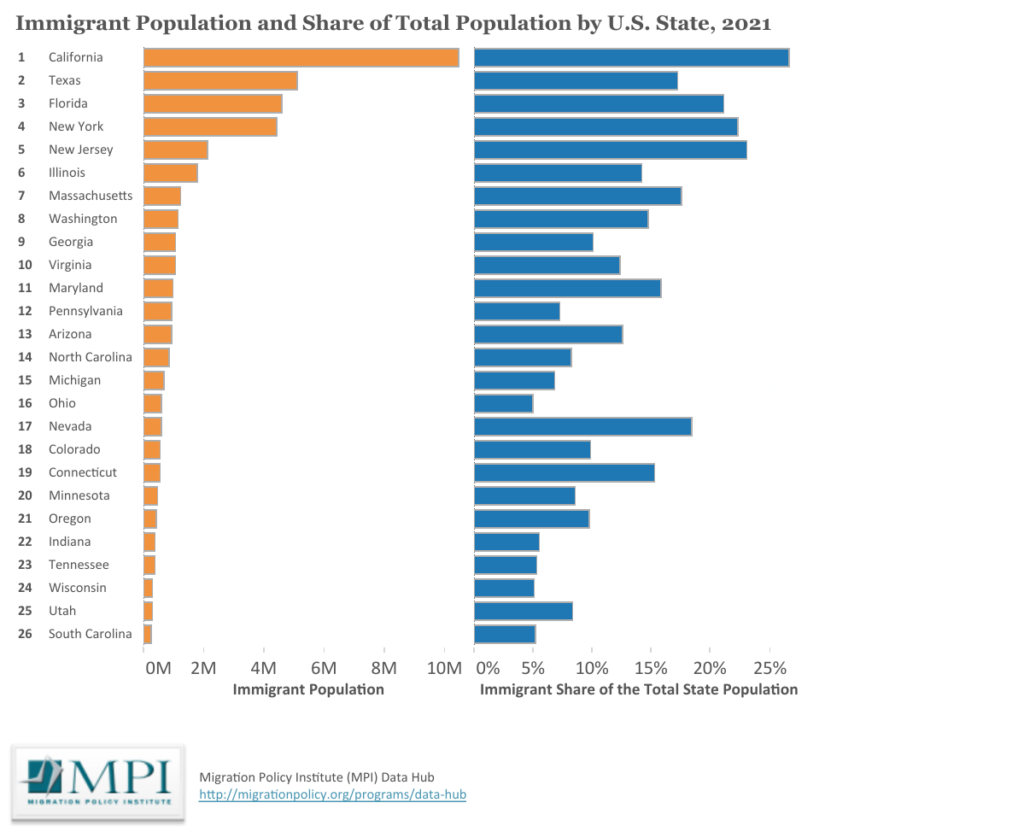
Figure 61: Immigrants by state. Source: Migration Policy Institute WW186
The gateway cities are pretty clear from a mapping of immigrant populations by metropolitan areas.
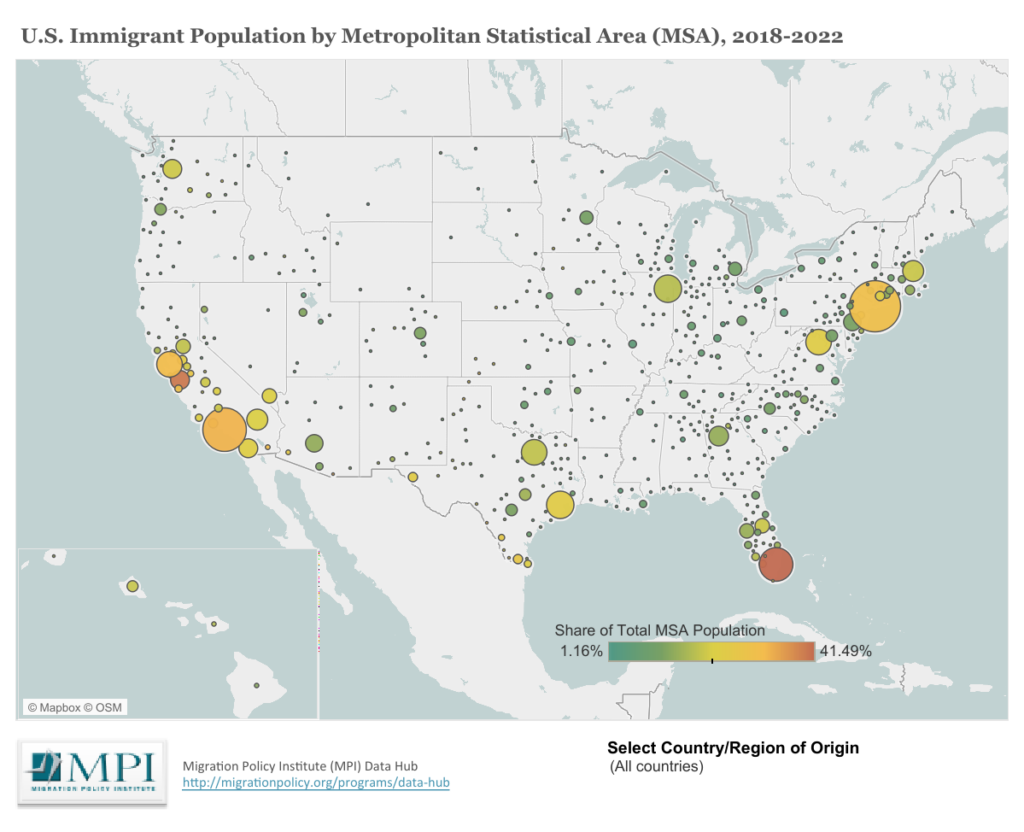
Figure 62: Immigrant Concentrations in the US. Source: https://www.migrationpolicy.org/programs/data-hub/charts/us-immigrant-population-metropolitan-area WW187
Immigrants to the US come from a wide range of countries and regions. At this point in time, most immigrants come from Asia, followed closely by Mexico. Here’s where authorized immigrants admitted in 2017 came from.
Table 19: Where US immigrants came from in 2017. Source: Table 2 of Department of Homeland Security, 2017 yearbook.
| Europe | 89,706 |
| Asia | 404,371 |
| America | 489,676 |
| Africa | 116,667 |
| Australia region | 5,986 |
| Not Specified | 20,761 |
| Total | 1,127,167 |
As the table below indicates, naturalized US citizens (immigrant citizens) have much the same earnings and a lower household poverty rate than households headed by native born citizens, while immigrants who are not citizens earn less and have higher poverty rates.
Table 20: Some Basic Demographic Data for the US. Source: US Census Bureau, Table 50501 for 2019
| Foreign born | |||||
| United States, 2019 | Total | Native | Foreign born total | Naturalized citizen | Not a U.S. citizen |
| Total population | 328,239,523 | 283,306,622 | 44,932,901 | 23,182,917 | 21,749,984 |
| Median earnings (dollars) for full-time, year-round workers | |||||
| Male | $52,989 | $55,483 | $46,591 | $56,813 | $38,612 |
| Female | $43,215 | $44,584 | $39,159 | $45,974 | $30,589 |
| Household mean earnings | |||||
| Household mean earnings | $93,563 | $93,077 | $95,965 | $108,240 | $79,812 |
| Family Statistics | |||||
| Average family size | 3.23 | 3.12 | 3.72 | 3.61 | 3.89 |
| Families in poverty | 13.80% | 13.10% | 16.30% | 10.00% | 22.90% |
Recent work on prospects of immigrants and their children shows that first generation immigrants close the income gap with natives somewhat over the course of their lives, but their 2nd and 3rd generation children do quite well. One possible explanation is that immigrants are both more likely to settle in growing areas, and more likely than natives to move to such areas, and these are precisely the places (California, Texas) where opportunities for advancement are best.
Immigration and the Aging Workforce in the US
We’ve noted that immigration grows the size of the economy (GDP) but probably doesn’t have much effect on average productivity (GDP per worker). We’ve also noted that certain occupations and industries rely heavily on immigrants. But immigration also has an important effect on population growth and in particular the size of the working age population. The US population is aging, with the ratio of working people to retirees declining. Without immigrants who come here during their working years, this ratio would be declining faster. The United States, like other advanced economies, has a birth rate that is considerably below the replacement rate. The birth rate needed to keep the population from falling is 2.1 births per woman but for some time now in the US it’s been around 1.7 births per woman. That means that fewer and fewer working age people will need to support a growing population of retirees over age 65. This ratio, called the “old age dependency ratio” has been growing even while the US has been admitting a million authorized immigrants a year. Without immigration, the ratio would be growing faster, and in fact the Census Bureau says the US population as a whole would start dropping[39]. A few charts tell the story.
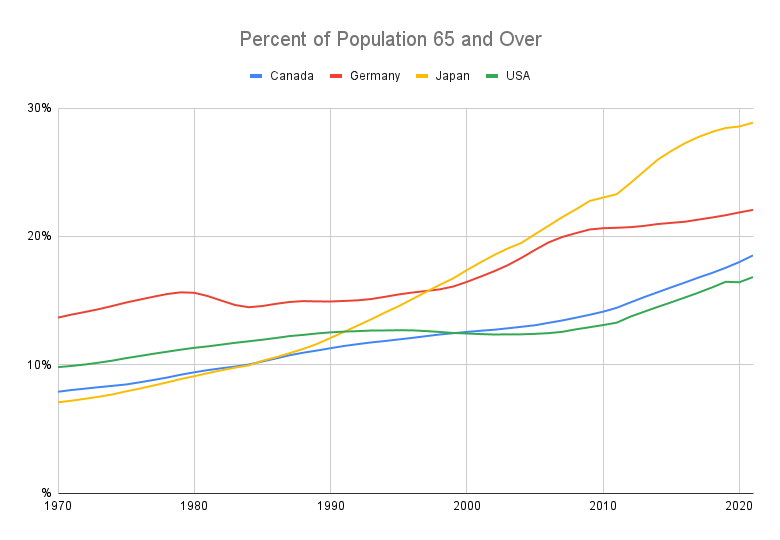
Figure 63: Percent of population 65 or over, selected countries. Source: OECD https://data.oecd.org/pop/elderly-population.htm#indicator-chart WW188
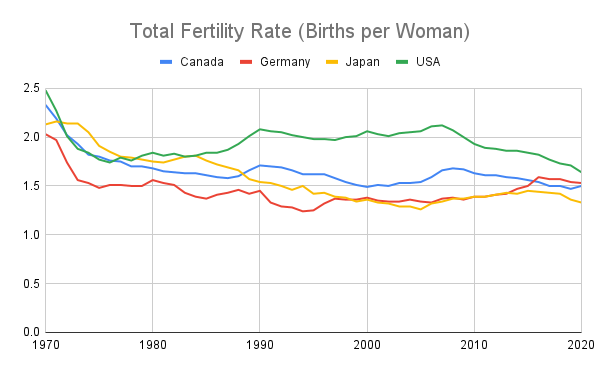
Figure 64: Average births per woman over her lifetime. A total fertility rate of less than 2.1 means the population will fall. Source: OECD https://data.oecd.org/pop/fertility-rates.htm#indicator-chart WW189
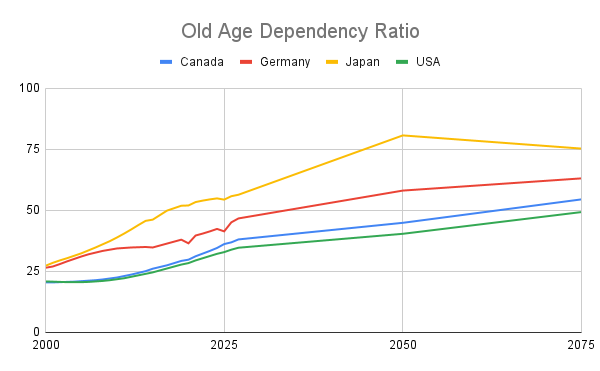
Figure 65: The Old Age Dependency Ratio Projected out to 2075. The ratio is defined as the number of individuals aged 65 and over per 100 people of working age, defined as those at ages 20 to 64. The predicted old-age to working-age ratios depend on mortality rates, total fertility rates and migration predictions. Expected immigration based on historical trends is included. With lower immigration the ratio climbs faster. Source: OECD https://data.oecd.org/pop/old-age-dependency-ratio.htm#indicator-chart WW190
Total fertility rates worldwide are falling, and as mentioned, are well below the replacement rate in advanced economies. Immigrants arrive in their prime working years, the average age of an immigrant in 2019 was 30. Of course, immigrants age too, and their total fertility rate, while slightly higher than the native born, is still below the replacement rate. Considering this strictly from a dynamic perspective, maintaining a constant population, never mind a growing one, would require a continuing influx of younger immigrants to make up for the low birth rate in the US (both native born and immigrant). The influx of young immigrants required to exactly balance the otherwise declining population is pretty modest to judge from US Census Bureau calculations[40]. But there is also the issue of maintaining the working age population as baby boomers retire and the old age dependency ratio creeps up. As the chart above shows, in the US there already are fewer than 4 prime working age people for each person 65 and older. Given the way social security and other retirement programs are financed[41], an increasing old age dependency ratio will place a growing burden on the working population or require curtailing benefits and/or reducing costs. Because not everyone works or pays payroll taxes, in 2019 only 3.1 workers supported one beneficiary, a number that is expected to decline to 2.4 workers by 2030[42]. The primary Medicare trust fund is on track to be exhausted by 2030, after which benefits would have to be reduced somewhat to equal revenue from the payroll tax and other sources[43]. Clearly more working age people would help us get over this demographic hump. One estimate of the number of immigrants required to keep the old age dependency ratio from rising further is around 370,000 above the current roughly 1 million per year[44]. Of course, as we live longer and stay healthier, more of us can continue to work after age 65. Also, there is evidence that programs such as providing universal preschool, child tax credits, and childcare subsidies have a modest positive effect on fertility rates[45]. Eventually, as we will discuss later, the paradigm of endless growth will not only have to come to an end but will do so naturally as the global birth rate declines.
The Big Picture on US Immigration
It is easy to get bogged down in details and lose sight of the big picture, so let’s review.
Because of declining birth rates, the United States and other advanced economies are heavily dependent on immigrants and temporary workers to keep their economies going and growing. In the US, under the immigration law passed by Congress in 1965 and updated in 1986 and 1990, over a million immigrants a year are legally accepted into the US, of which around 10% are refugees, and a much smaller number are asylum seekers. There is also a pool of over 3 million non-migrant temporary guest workers.
Economists agree that immigrants increase the size of the economy through growing GDP, and either have little, or a somewhat positive effect, on overall productivity. Most of the increase in GDP accrues to the immigrants themselves.
Recent immigrants can depress the wages of less educated native-born workers, and also earlier recent immigrants. While highly educated immigrants are thought to increase overall productivity, they also may depress the earnings of some native-born workers in specific fields. Neither of these effects is dramatic. Immigrants who have been in the country for ten years or more are thought to have little effect on wages.
From a fiscal perspective, low skilled immigrants are a net positive over time for the Federal Government because of the taxes they pay, but a net negative for state and local governments. Overall, the “expected value” of a young immigrant is significantly positive.
Because of the aging of the baby boom generation, increased life expectancy, and declining birth rates, a smaller working population is being called on to support a growing older population. Immigrants arrive early in their prime work years which helps slow this increase in the old-age dependency ratio.
The US has the largest immigrant population in the world at over 45 million, or roughly 14% of the total population. While this is near a historic high, other countries, such as Canada, have a higher immigrant percentage.
In the United States, business and agricultural interests strongly back continued immigration at current or increased levels. Immigrant labor is particularly important in harvesting crops.
Immigration is thought to have a small ongoing effect on inequality in the US, however most of the growing inequality in incomes is attributable to other factors.
[1] See “Timeline.” 2018. Immigration History. The University of Texas at Austin Department of History. February 27, 2018. https://immigrationhistory.org/timeline/. Also https://en.wikipedia.org/wiki/Immigration_and_Nationality_Act_of_1965
[2] Source: U.S. Department of Homeland Security Yearbook 2017 https://www.dhs.gov/immigration-statistics/yearbook/2017 see Table 25
[3] For an estimate of the number of individuals and other details see Teke, John, and Waleed Navarro. n.d. “Nonimmigrant Admissions and Estimated Nonimmigrant Individuals: 2016.” Accessed January 29, 2023. https://www.dhs.gov/sites/default/files/publications/Nonimmigrant%20Admissions%20and%20Estimated%20Nonimmigrant%20Individuals%20Fact%20Sheet%202016_0.pdf.
[4] https://www.factcheck.org/2018/06/illegal-immigration-statistics/
[5] This includes all the foreign born who have lived in the country for a year or more. Note that by this definition, the US has an immigrant population of 15%. Data is from https://www.un.org/development/desa/pd/content/international-migrant-stock via Our World in Data.
[6] https://www.uschamber.com/immigration/calling-on-congress-fix-americas-broken-immigration-system accessed 1/29/2023.
[7] “Agriculture Labor Reform.” n.d. American Farm Bureau Federation. Accessed January 29, 2023. https://www.fb.org/issue/labor/agriculture-labor-reform.
[8] It is widely believed that the refugee system worldwide, as laid out in United Nations documents following World War II, is broken. See Katz, Matt. 2020. “The World’s Refugee System Is Broken.” The Atlantic, February 29, 2020. https://www.theatlantic.com/international/archive/2020/02/japan-refugees-asylum-broken/607003/.
[9] https://www.adl.org/resources/tools-and-strategies/what-title-42-and-what-does-it-have-do-asylum?gad_source=1&gclid=Cj0KCQiA1rSsBhDHARIsANB4EJa9gmeXdYGztMG-RIeNpu8xt1XtpLtVHzMB-ohIf8fNRN_AEolGZF0aAgJaEALw_wcB&gclsrc=aw.ds
[10] https://www.nytimes.com/interactive/2023/10/29/us/illegal-border-crossings-data.html
[11] There were over 2 million “encounters” in fiscal years 2022 and 2023 when Title 42 was still largely in effect. Title 42 does not penalize recurrent illegal border crossings, but Title 8 does, so many of the Title 42 encounters were repeated attempts.
[12] Council on Foreign Relations https://www.cfr.org/backgrounder/central-americas-turbulent-northern-triangle
[13] https://immigrationforum.org/article/the-reasons-behind-the-increased-migration-from-venezuela-cuba-and-nicaragua/
[14] https://immigrationforum.org/article/the-reasons-behind-the-increased-migration-from-venezuela-cuba-and-nicaragua/
[15] Schlosser, Eric. 2019. “Why It’s Immigrants Who Pack Your Meat.” The Atlantic, August 16, 2019. https://www.theatlantic.com/ideas/archive/2019/08/trumps-invasion-was-a-corporate-recruitment-drive/596230/.
[16] Barboza, David. 2001. “Meatpackers’ Profits Hinge on Pool of Immigrant Labor.” The New York Times, December 21, 2001. https://www.nytimes.com/2001/12/21/us/meatpackers-profits-hinge-on-pool-of-immigrant-labor.html.
[17] National Academies of Sciences, Engineering, and Medicine, Division of Behavioral and Social Sciences and Education, Committee on National Statistics, and Panel on the Economic and Fiscal Consequences of Immigration. 2017. The Economic and Fiscal Consequences of Immigration. National Academies Press. Page 25
[18] National Academies of Science, 2017, Page 5
[19] Borjas, George J. 2019. “Immigration and Economic Growth.” Working Paper Series. National Bureau of Economic Research. https://doi.org/10.3386/w25836. Table 2.
[20] Many studies use years of education to assign a skill level, we will use “years of school” to identify “skill level” when that is the case. Other studies assign skill level by occupation. For example, carpenters and construction workers are classified as skilled, while metalworkers and textile workers are classified as unskilled.
[21] National Academies of Science, 2017, Chapter 5
[22] National Academies of Science, 2017, Page 5
[23] National Academies of Science, 2017, Page 6
[24] National Academies of Science, 2017, Page 242, Table 5-2
[25] This estimate was for the 1990’s. See National Academies of Science, 2017, page 327.
[26] NASC 2017, page 11
[27] NASC 2017, page 12
[28] NASC 2017, page 11
[29] Conclusion from the National Academies of Science, 2017 summary, page 7
[30] One study concluded that “patenting activity by foreign-born college graduates is estimated to have increased U.S. GDP by 1.4-2.4 percent over the decade of the 1990s” NASC 2017, page 71.
[31] GSP is like GDP, but for the state.
[32] Peri, Giovanni. n.d. “Immigration, Labor Markets, and Productivity.” Accessed February 16, 2022. https://ciaotest.cc.columbia.edu/journals/cato/v32i1/f_0024452_19953.pdf, finds a positive impact on total factor productivity, employment, and wages when looking at growth in immigrants as a percent of state population versus measures such as the growth of gross state product (GSP) per worker over time. Borjas, George J. 2019 in “Immigration and Economic Growth.” Working Paper Series. National Bureau of Economic Research. https://doi.org/10.3386/w25836 finds that growth in GSP correlates with growth in immigrant percent by state, but growth in GDP per capita measured over time is not significantly different from zero (i.e. neither increases nor decreases productivity growth when other factors are included).
[33] At first glance these two roughly 25% numbers are confusing. But it turns out that California’s total population in 2019 was 39 million, so roughly a quarter of that is 10 million which is also roughly a quarter of the 44 million authorized and unauthorized migrants in the US.
[34] These California statistics (cross checked by the author) are mostly sourced from the American Immigration Council, which works on behalf of immigrants. https://map.americanimmigrationcouncil.org/locations/california/
[35] https://www.migrationpolicy.org/programs/data-hub/charts/us-immigrant-population-metropolitan-area. If we remember that most immigrants come under the family reunification preference, it is not surprising that they will settle near each other.
[36] NASC 2017, page 296
[37] NASC 2017, page 280
[38] Card, David. 2009. “Immigration and Inequality.” Working Paper Series. National Bureau of Economic Research. https://doi.org/10.3386/w14683.
[39] https://www.census.gov/content/dam/Census/library/publications/2020/demo/p25-1146.pdf
[40] The Census projected population growth from 2016 to 2060 under various immigration policies. Under a “low immigration” policy, the population would grow by 53 million or 16% over the period, under a “zero immigration policy” the population would decline by 3.4 million (minus 1.1%). https://www.census.gov/content/dam/Census/library/publications/2020/demo/p25-1146.pdf
[41] Social Security and part of Medicare are financed by payroll taxes, so the current working population pays in, and the retiring working population collects. During the baby boomers prime working years, a large surplus was built up in the Social Security Trust Fund. That
[42] https://www.taxpolicycenter.org/briefing-book/what-medicare-trust-fund-and-how-it-financed
[43] Kaiser Family Foundation has a good overview at https://www.kff.org/medicare/issue-brief/faqs-on-medicare-financing-and-trust-fund-solvency/.
[44] “Room to Grow: Setting Immigration Levels in a Changing America.” 2021. National Immigration Forum. February 3, 2021. https://immigrationforum.org/article/room-to-grow-setting-immigration-levels-in-a-changing-america/.
[45] Miller, Claire Cain. 2021. “Would Americans Have More Babies If the Government Paid Them?” The New York Times, February 17, 2021. https://www.nytimes.com/2021/02/17/upshot/americans-fertility-babies.html. Fertility rates drop with development, and then tick up a bit as countries get richer.
