Up to now, we’ve looked at productivity in countries that are described as “advanced economies” meaning that by and large they have been able to adopt the latest productive technologies and production methods that minimize costs. These advanced economies include the countries of North America, Europe, Australia, Japan, Taiwan, and a few others. Most of the population of the world do not live in such economies, but rather in countries that are somewhere on a spectrum of economic development.
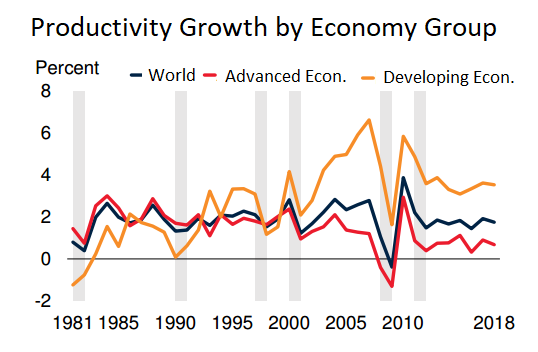
Countries which are not on the productivity frontier in all sectors of their economies clearly have room for catch-up growth since they could leapfrog to advanced production technologies. In countries where a large part of the population is still employed in agriculture, modernizing agriculture, and employing those workers in other ways, will grow GDP and hence productivity. Indeed, basic economic theory suggests that growth in productivity should be fastest where there is less capital per worker because adding machines produces the biggest productivity increases at first and less as more are added (declining returns to capital). And indeed, developing countries have higher rates of productivity growth than “advanced economies” as shown in this chart from the World Bank report on global productivity.
.

Figure 18: Source: Figure 1 from World Bank Group. 2022. “Global Productivity: Trends, Drivers, and Policies.” World Bank Group. CC BY 4. WW154
The chart shows several things: declining productivity increases in advanced economies; productivity growth speeding up in developing countries starting in the late 1990s; the V-shaped dip in productivity in 2008 caused by the Global Financial Crises; and the relative stability of the growth rates in productivity since. The developing countries continue to have a higher productivity growth rate than the “advanced” economies, which over time should reduce the difference in productivity between these groups. Economists refer to this shrinkage in productivity differentials as “convergence”.
The process by which countries modernize economically is called economic development, and the pace of such development varies widely. How has productivity grown worldwide in the last few decades, and what factors influence the rate of growth?
Development: From Agriculture to Industry to Services
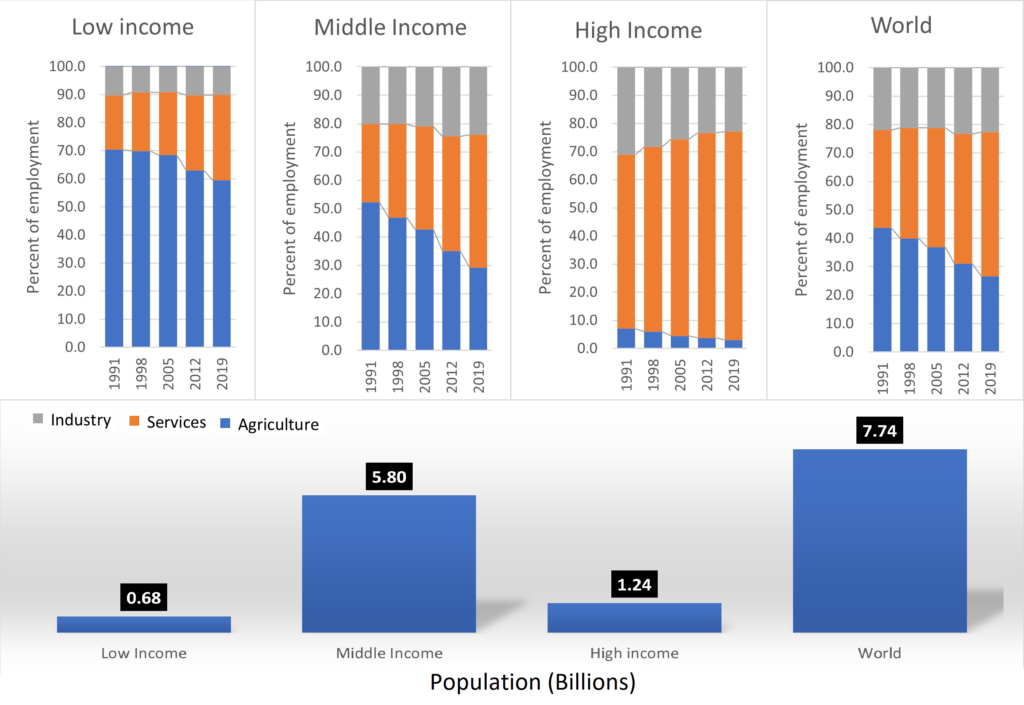
Developing countries are following much the same trajectory of development that the advanced economies followed, although later, and the path they take is somewhat country and region dependent. China, for example, has a rapidly growing manufacturing sector, increasingly for its domestic market. This is hardly surprising; China’s large rural population continues to migrate to the cities and the demand for consumer goods continues to grow. While in the United States there are 910 vehicles on the road for every 1,000 people, there are only 37 vehicles per 1,000 people in China[1]. Even in China, though, manufacturing value added as a percentage of GDP and employment is falling. The GDP pie is growing rapidly, and along with it manufacturing: China’s GDP grew 7-fold between 2004 and 2019, but manufacturing value-added grew “only” 6-fold.[2] Manufacturing has been a way for less developed countries to earn trade revenue and build up capital. There is some evidence that this is no longer so true as manufacturing has fallen as a percent of GDP in many smaller economies as well.[3] The chart below shows how employment has changed in countries grouped by income over time.

Figure 19: Employment by sector and country group in 2019. The industry sector consists of mining and quarrying, manufacturing, construction, and public utilities. Data Source: World Bank Indicator Data. My Chart: World % Emp WDI My Version.xlsx WW118
This chart makes clear that as development proceeds a country’s employment shifts from low productivity agriculture to industry and services, and over time, the latter has become more important. It looks like industrial employment, which includes manufacturing, mining, construction, and utilities in this World Bank Data, stabilizes at around 20% of employment.
Globally, productivity varies enormously between countries, but has risen everywhere over time. The expression “a rising tide lifts all boats” certainly applies to rising productivity: the fraction of the world’s population living in extreme poverty fell from 36% in 1990 to 10% in 2015. Extreme poverty fell most in countries with the highest rates of productivity growth[4].
Unfortunately, the fact that the productivity growth rate in developing countries is now higher than in advanced economies has to be checked against the still huge gap in average productivity, and consequently incomes, between the two sets of countries. Productivity in the emerging and developing economies is only around 20% of advanced economies, and low-income countries produce only about 2% as much output per worker[5]. At the current average rate of productivity convergence of half a percent per year it would take middle- and lower-income countries over 100 years to close half the productivity gap with advanced economies[6]. However, productivity increases are far from uniform among developing nations. Some, such as Singapore which now has higher per capita income than the US, managed to increase output dramatically over a period of many years. South Korea, another convergence success story, is now included among the developed high-income economies.
Why is it that some countries have improved productivity so much more quickly than others, and can other countries follow their trajectory? Economists have used statistical methods to group countries with similar productivity growth patterns to find factors that correlate with increased growth. They find that faster growing countries have been characterized by better initial education levels, greater political stability and governance, and greater or deepening economic complexity. “Economic complexity” refers to having a wider variety of industries and trading relationships. It should be noted that correlation does not equal causation, as statisticians like to say, but at least in the case of good governance and a higher initial education level the direction of causation seems intuitive. Both the amount of foreign direct investment and openness to trade also show some correlation with an increased growth rate. In general commodity exporting economies, especially those relying on agricultural exports, have lower productivity growth rates than commodity importing countries because income from commodities varies from year to year, and reliance on commodity income can stifle the development of other industries[7]. Finally, other things being equal, the rate of growth is faster when countries start poorer as one would expect from declining returns to capital.
What can we learn from these correlations about the ability of countries to rapidly increase productivity? Should they concentrate on education? On attracting foreign direct investment? On opening up to trade? On “governance”?
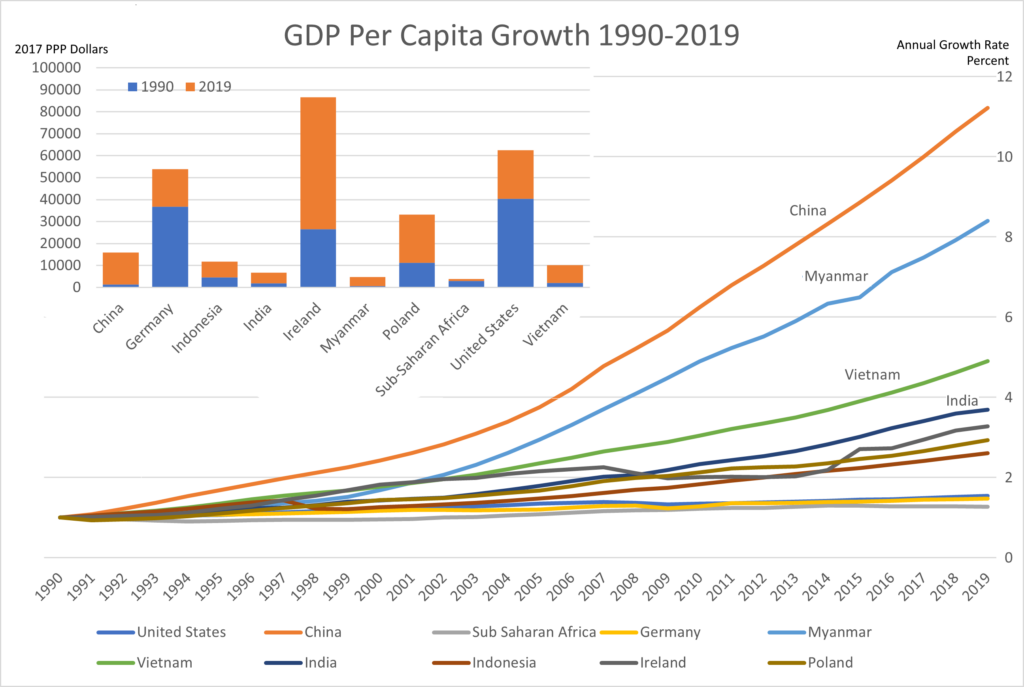
The answer is that these things go hand in hand. Stability and low levels of corruption are necessary to attract foreign investment, education is needed to support advanced manufacturing and service industries, and trade is needed to integrate with the global economy. With these factors in place, economies can grow by steadily increasing investment, both public and private. The Chart below shows a sample of countries, and their productivity increases over the last 30 years.

Figure 20 Annual GDP per Capita Real Growth Rates (large chart), and actual GDP per capita (small chart). Source: World Bank Indicator Data. This data is in 2017 dollars adjusted for both inflation and differences in purchasing power (PPP) between countries. WW120
China’s GDP per capita grew nearly 12-fold in that time period, meaning that, if the benefits of GDP growth were distributed evenly, the average Chinese person’s real income could have increased by a factor of 12. GDP includes investment, and the Chinese are big savers, investing nearly half of their GDP each year compared to a world (and US) average of around 20%. About half of China’s savings is by households, the rest by companies and the government[8].
In the chart, productivity growth in the United States, Germany and Sub-Saharan Africa look to be a flat line at the bottom, but actually US real output per capita increased about 50% over the 29 years even though the rate of increase stayed flat at around 1.5% annually. Again, it is important to keep in mind that China and other high growth countries started with a very low comparative GDP per capita, the inset chart shows GDP per capita for the same set of countries. Despite high compound growth, actual dollar increases in advanced economies were higher than the developing ones, as is shown in the small inset graph. Some economists willing to go out on a limb predict it will take at 50 years for China’s GDP per capita to catch up with the United States[9]. None the less this kind of growth is enviable. Can other countries reproduce it? Will it continue? In the box below we look at how China achieved the amazing growth we’ve seen in the last 40 years or so.
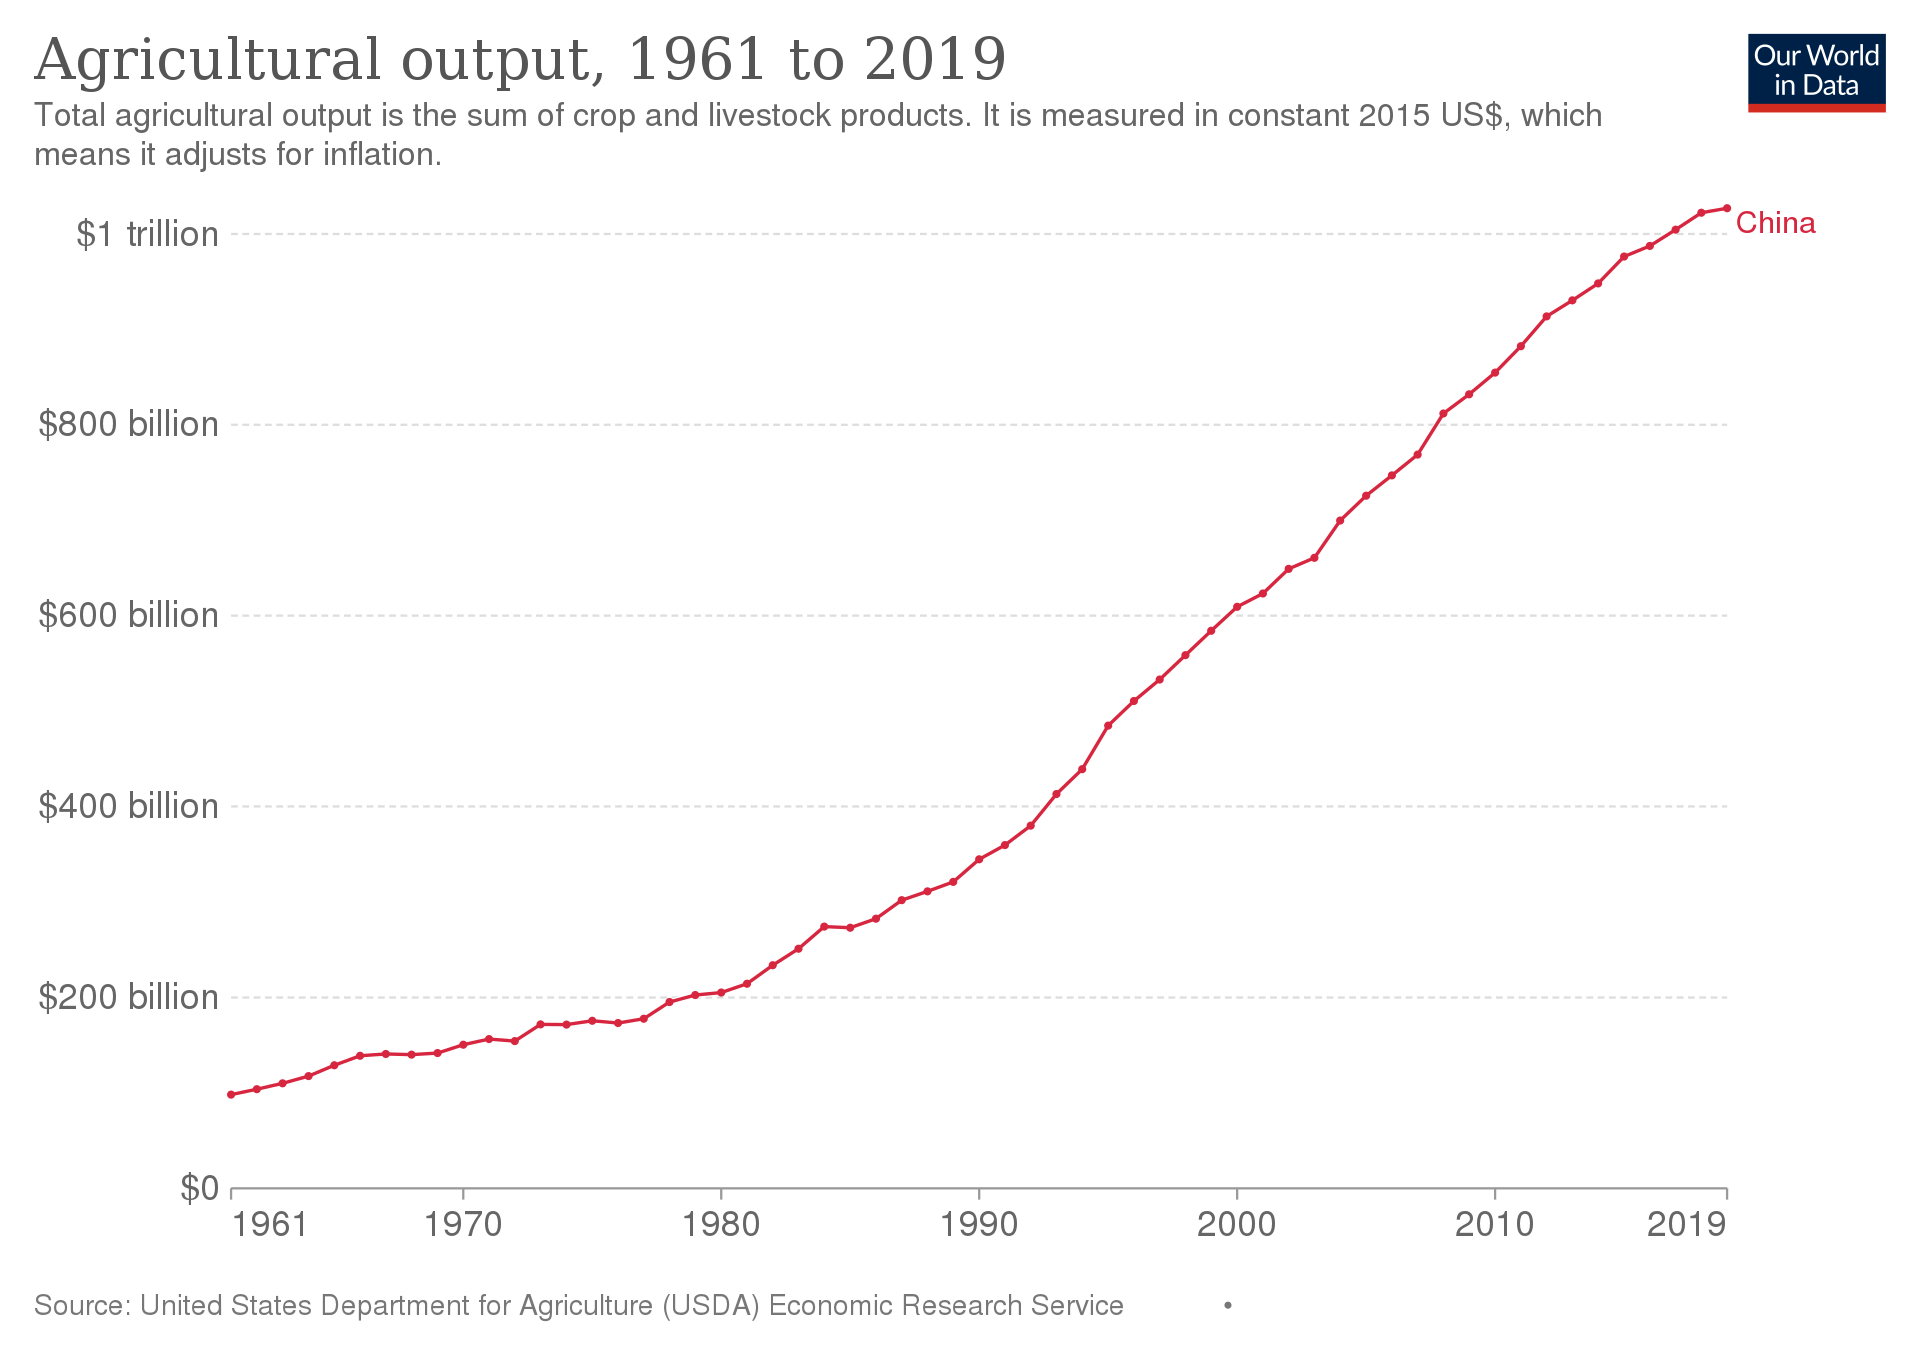
| China’s Growth Example China is an ancient country with a long and complex history. When the Communist party first came to power in 1949, it adopted a “Soviet” style development policy which stressed investment in heavy industry as the key to economic development. Agriculture was collectivized, although the size and administration of farming units underwent changes depending on the politics of the time. Despite the Chinese propensity to save and invest, output was inadequate to allow for investment in both agriculture and industry, and by the early 1960s, investment priority had shifted to agriculture because agricultural productivity growth was barely keeping pace with population growth. During the period from 1960 until the death of Mao Tse Tung in 1976 growth alternated with periods of political turmoil including the “Great Leap Forward” – which turned out to be a great leap backwards – and the Cultural Revolution. The modern era of the Chinese economy is usually pegged as starting in 1978, although reforms had been ongoing. At the Party Congress of December 1978, a reform program was adopted that called for increasing use of market mechanisms to improve productivity. In agriculture, the “Household Responsibility System” let farm families lease land from the state and make their own decisions about what and how much to grow. Farm products could be sold at prices determined by the market. By 1984, agricultural production had boomed following the institution of the household responsibility system, which replaced collective farming. Then-Premier Zhao Ziyang wrote in his memoirs that in the years following the institution of household responsibility system, “the energy that was unleashed … was magical, beyond what anyone could have imagined. A problem thought to be unsolvable had worked itself out in just a few years’ time … [B]y 1984, farmers actually had more grain than they could sell. The state grain storehouses were stacked full from the annual procurement program.”[10] The market reforms made for better decision making and incentives, and the ensuing increase in output in Chinese agriculture was due to increased productivity on the 10% of arable land in China.  Figure 21: Chinese agricultural output in constant US dollars. Credit: Our World in Data. WW155 Industry too was reformed to allow for more management autonomy and market involvement by the state-owned enterprises. Private and “joint ownership” firms rapidly expanded in number and output. State owned enterprises, which still produce about 25% of GDP today[11], had to compete on the open market and had to borrow money at interest from the Bank of China rather than receiving direct budgetary allotments. Over time, price controls which had set prices for commodities were relaxed or eliminated. All these moves towards free markets had the desired result of increasing competition and productivity and expanding the range of goods and services available. In trade, China moved from a policy of self-sufficiency to regarding trade as an important source of investment funds and modern technology. In the early 1980’s, “special economic zones” were set up in which trade with foreign firms was encouraged. Protections for private property were instituted. Given the low cost of Chinese labor, foreign investment in manufacturing poured in, at first especially in clothing and textiles. In the special economic zones, which served as economic “laboratories”, factories owned primarily by investors in Hong Kong and Taiwan produced mountains of clothes under conditions reminiscent of Britain’s industrial revolution. By 2000, while textiles and apparel exports had continued to rise exponentially, consumer electronics had grown even faster and constituted the largest export sector. More recently China has undertaken major investments in infrastructure and housing. Public infrastructure such as roads, railroads, subways, power generation and transmission, water management, and telecommunications have a return on investment just as private investment does and are essential for growth. By some estimates, return on additional infrastructure investment is now roughly on par with returns on private investment[12]. China today has more or less balanced trade[13], a large and growing middle class, and is shifting from an export focused economy to one based largely on internal demand fueled growth. It is probable that China’s growth rate will begin to slow in the near future if it hasn’t already, the population is aging for one thing. China’s case provides some lessons. While there was substantial investment in heavy industry prior to economic liberalization, it wasn’t until market forces and incentives were unleashed that productivity started to take off. The improvement in agricultural productivity allowed large numbers of workers to migrate to the cities where they were employed in the factories resulting from trade liberalization. The comparative advantage of China in labor combined with a high propensity to save, provided capital for investments both private and public, which in turn drove further productivity increases. |
[1] https://capitol-tires.com/how-many-cars-per-capita-in-the-us.html
[2] World Bank indicator data
[3] Rodrik 2016
[4] World Bank Group. 2022. “Global Productivity: Trends, Drivers, and Policies.” World Bank Group. https://www.worldbank.org/en/research/publication/global-productivity, page 25
[5] World Bank Group, 2022, page 201
[6] World Bank, 2022, page 212.
[7] Oil exporting countries are sometimes among the highest in per capita income simply because they have large oil-fueled GDP and comparatively low populations. Their “productivity” in terms of GDP per capita is highly dependent on the price of oil.
[8] These are “gross savings” rates. When depreciation is considered, the US savings rate is about 3.6%. Of course, when machines etc. are replaced, productivity can be increased.
[9] See https://www.cnbc.com/2021/03/26/us-will-remain-richer-than-china-for-the-next-50-years-or-more-eiu.html.
[10] https://en.wikipedia.org/wiki/Economic_history_of_China_(1949%E2%80%93present)
[11] “Zhang, Chunlin. 2019. How Much Do State-Owned Enterprises Contribute to China’s GDP and Employment? World Bank, Washington, DC. © World Bank. https://openknowledge.worldbank.org/handle/10986/32306 License: CC BY 3.0 IGO.”
[12] There currently appears to be a housing bubble in China resulting from overbuilding and speculation.
[13] While China has huge exports and imports, they are pretty close in size leaving a 0.7% trade surplus.
