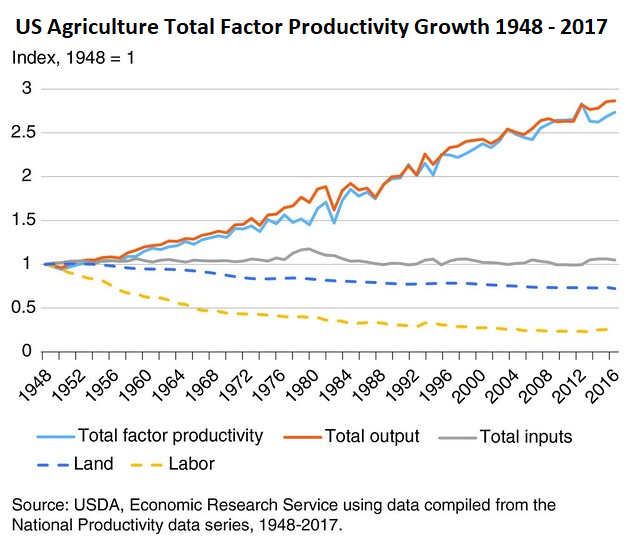
Looking at agriculture, we note that the US has nearly balanced imports and exports in agricultural products, and that output has more than doubled between 1960 and 2019 while the US population has grown by 75% [1]. What is more, the amount of land used by agriculture in the US has remained almost constant. We can infer that, as in the past, productivity increases have continued to reduce the amount of labor required in agriculture[2]. Some of this productivity increase is due to improved technology, crops, and fertilizers, but some is due to increased economies of scale which have resulted in the decline of smaller family farms. Twice the amount of food is being farmed using less than half the labor. The chart below shows output and inputs in US agriculture.

Figure 10: US Agricultural Productivity Growth, Source: US Department of Agriculture, Economic Research Service, using data compiled from the National Productivity data series, 1948-2017 WW117
The chart shows that we’re producing about three times as much now as we did in 1948 while using less land and one quarter of the labor. Overall inputs, which include labor, land, fertilizer, fuel, and machines, have stayed about the same which is why total factor productivity (which measures the growth in productivity of all input factors combined) has grown along with output. Labor productivity has increased enormously, by a factor of almost 12 since 1/4 the labor produces almost 3 times the output. No wonder agricultural employment has fallen. In terms of dollar output, it is perhaps shocking to discover that even though agricultural output has tripled since 1960, farm output represents less than one percent of US GDP![3]
Worldwide the “Green Revolution” in high yielding crop varieties and the application of modern technologies and fertilizer has similarly raised world food production, allowing for the continued growth of earth’s human population, and largely eliminated widespread famine.
All of this is great news but has resulted in fewer agricultural jobs in industrialized countries such as the US. As is the case with any productivity increase, total GDP goes up since the same or greater output is being produced with less resources and displaced workers find work producing other goods and services which adds to total output. The migration of farm workers to the cities as agricultural productivity increased underpinned the early industrial revolutions. Since 1960 the “rural” population of the US has gone from 30% to 17% today and that population has aged[4].
While farm output, at $134.7 billion, represents just 0.6 percent of GDP, agricultural products are processed, cooked in restaurants, sold in stores, transported, and made into garments among other things. The USDA calculates that food related industries contribute about 5 percent of US GDP, or around $1 trillion current dollars[5]. These industries fall in either the manufacturing or services sectors though. For them agricultural products are simply intermediate inputs.
In summary, in the US and other advanced economies, agriculture, perhaps despite our preconceptions, is a tiny part of the employment and indeed economic output picture. Agricultural total factor and labor productivity have steadily increased, and it is likely that productivity will continue to increase, albeit more slowly, as technology and yields continue to improve. Looking at the last 10 years, it appears that farm labor requirements have stabilized at current levels in the developed countries. The winners from the increases in agricultural productivity have been all of us, as food prices have kept steady or in many cases fallen relative to the cost of living. In the US, chickens and corn roughly quadrupled in price between 1960 and 2019, but the consumer price index rose by over eight times[6]. Large farming operations have also been winners. The losers have included the displaced family farmers and rural communities that lost population. That said, society overall has benefited enormously from the lower prices of agricultural products.
[1]USDA Table 1. Indices of farm outputs, inputs, and total factor productivity for the United States, 1948-2019
[2] Trade, as we noted in the primer, creates economic incentives that encourage domestic industry to shift to the products produced with the most relative productivity.
[3] Down from 3.3% of GDP in 1960. A good quick overview of US agriculture economics and employment can be found at https://www.ers.usda.gov/data-products/ag-and-food-statistics-charting-the-essentials/ag-and-food-sectors-and-the-economy.
[4]The definition of rural versus metro is not clearcut. This statistic is from <a href=’https://www.macrotrends.net/countries/USA/united-states/rural-population’>U.S. Rural Population 1960-2022</a>. www.macrotrends.net. Retrieved 2022-04-05.
[5] “Ag and Food Sectors and the Economy.” n.d. Accessed April 6, 2022. https://www.ers.usda.gov/data-products/ag-and-food-statistics-charting-the-essentials/ag-and-food-sectors-and-the-economy/.
[6] Producer price index series from the BLS for chickens and corn, CPI data from the BEA.
