Where We Are Now and Trends
The Paris Climate Agreement called for actions to limit global warming to 1.5° C or at least “well below 2° C” based on the IPCC’s assessment of the consequences of greater warming.
To meet this target, 2010 levels of greenhouse gas emissions have to be reduced by 45% by 2030, and to “net zero” by 2050. “Net zero” means that any residual emissions have to be balanced by increased sequestration of carbon.
So how are we doing? The two charts below tell the story of CO2e emissions overall, and per person.
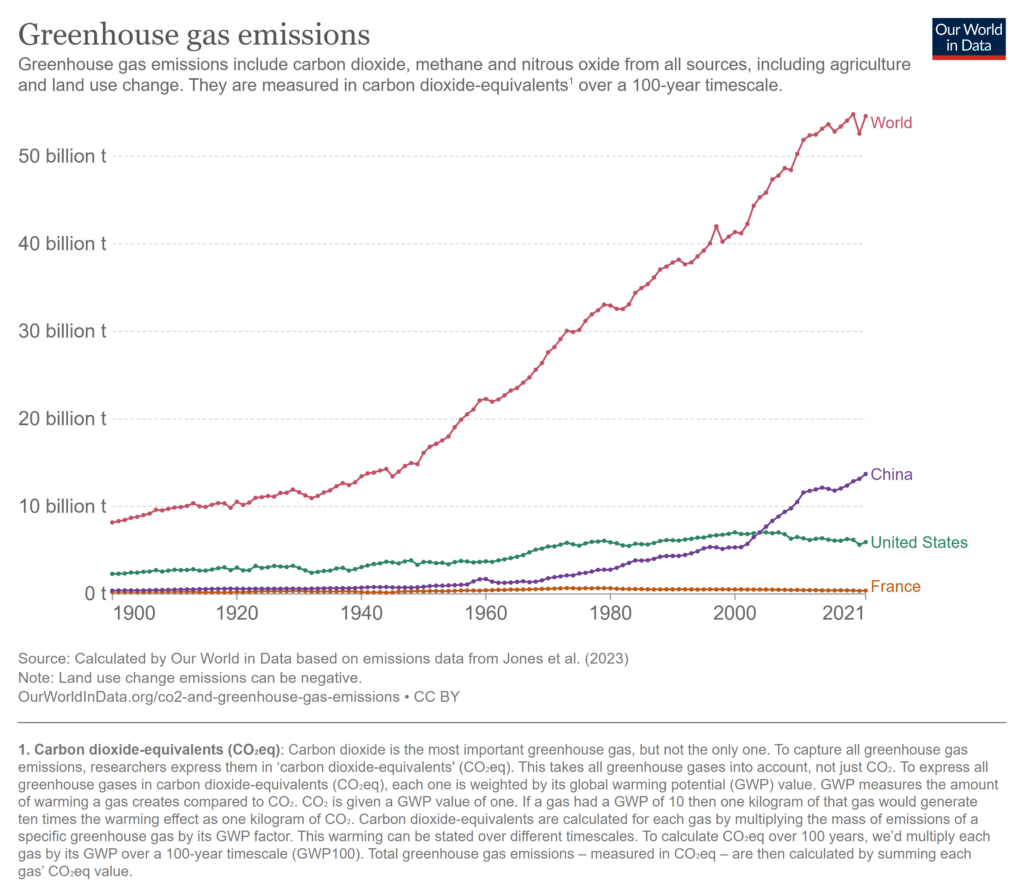
Figure 78: Greenhouse Gas Emissions in CO2e. Source: Our World in Data https://ourworldindata.org/greenhouse-gas-emissions. WW197
World CO2e emissions have increased from about 50 gigatons in 2010 to 54 gigatons annually in 2021. Hardly confidence inspiring. These charts are from Our World in Data. If you head over to the website, you can add other countries, change the timeline and investigate individual greenhouse gases. China is the largest emitter of greenhouse gases but also has the largest installed base of wind and solar power.
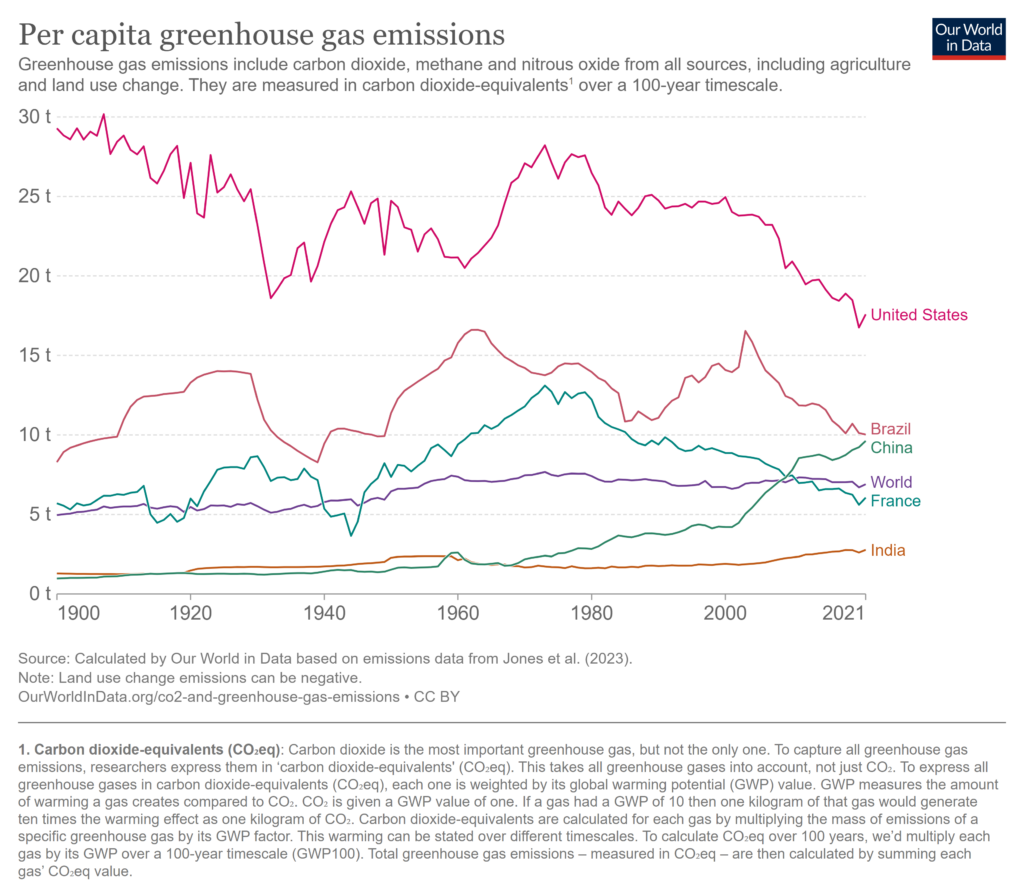
Figure 79: Per Capita Greenhouse Gas Emissions in CO2e. Source: Our World in Data https://ourworldindata.org/greenhouse-gas-emissions. WW198
When we look at emissions of CO2e per person, the story is mixed. The US is still the largest emitter per person, at 17.58 tons per person per year in 2021, but that’s a decline of almost 16% since 2010 (20.9 tons). China has seen a steep rise in emissions despite recent heavy investment in renewable energy. Note that emissions include methane and nitrous oxide which are primarily from agriculture and constitute about 17% of world CO2e emissions.
Just looking at the current CO2e trends is gloomy, but there is a reason for optimism. Green electric generation underlies many of the potential reductions going forward. If everyone drove an electric car, that would do nothing to curtail emissions if the electricity was generated from fossil fuels, but once the electric supply is greened, those electric cars become part of the solution. And the electric supply is greening, Bloomberg notes that renewable energy investment in the first half of 2023 was a record $358 billion ($716 billion annual rate), with solar accounting for most of that. China accounted for about half of the solar investment, with the US a distant second at $25.5 billion[1]. Two charts from the IEA tell the story of power investment. The first shows that spending on renewables and storage and grids now far surpasses spending on fossil fuel power, the second shows fuel supply investment which includes oil and gas exploration and extraction, pipelines, and the like. In an all (or mostly) electric future, very little would have to be spent on fuel supply.
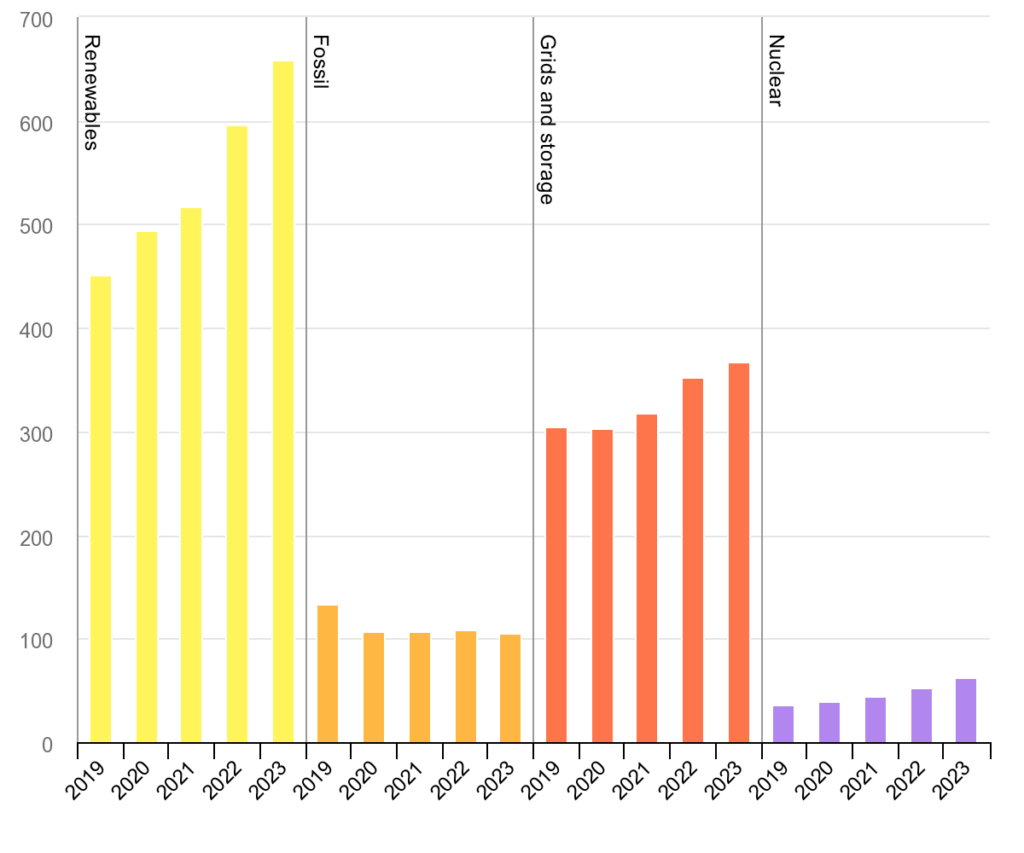
Figure 80: Investment in power generation and transportation. WW199
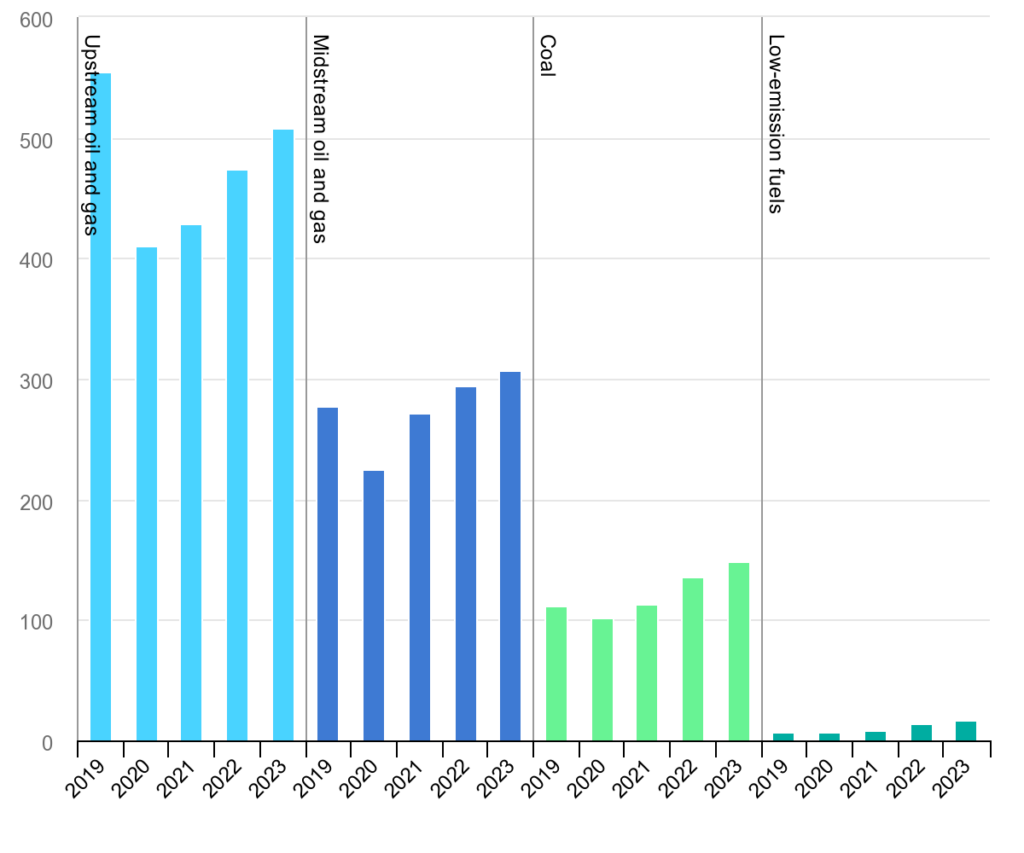
Figure 81: Investment in fuel supply. Source for both figures: International Energy Agency[2]. WW200
Bloomberg recently calculated that global spending on renewable energy investment needs to rise to about $1.2 trillion per year between 2023 and 2030, roughly double today’s rate, to stay on track to get to net zero by 2050[3]. That is about 1% of global GDP, and that includes what is needed to meet rising demand, so not just for abating existing sources. For example, China is planning to build a record 160GW of new wind and solar capacity in 2023, but that is not quite enough to keep pace with increased post-pandemic demand[4]. Chinese plans call for enough wind and solar to more than meet increased demand and start reducing emissions in the near future.
The chart below shows sources of electricity for three countries and the world. For the world as a whole, two major sources of green energy we haven’t discussed much are hydropower and nuclear. According to the International Energy Agency (IEA) only about half of the world’s economically viable hydropower has been tapped, but new plants are large, expensive and often contentious[5]. Hydro is one of the most flexible power sources since a plant’s output can be scaled up or down very quickly. Nuclear is the other major current source of green energy. As the chart shows, France invested heavily in nuclear power and releases virtually no CO2 from electricity production. The steep price declines in wind and solar have made nuclear a relatively expensive green power option, but it is attractive because it provides steady output, unlike wind and sun. There are new plants being built in Asia, particularly India and China, and paths to net zero call for a doubling of nuclear electricity generation by 2050. In the US, nuclear capacity is being maintained mostly by extending the lives of existing plants[6].
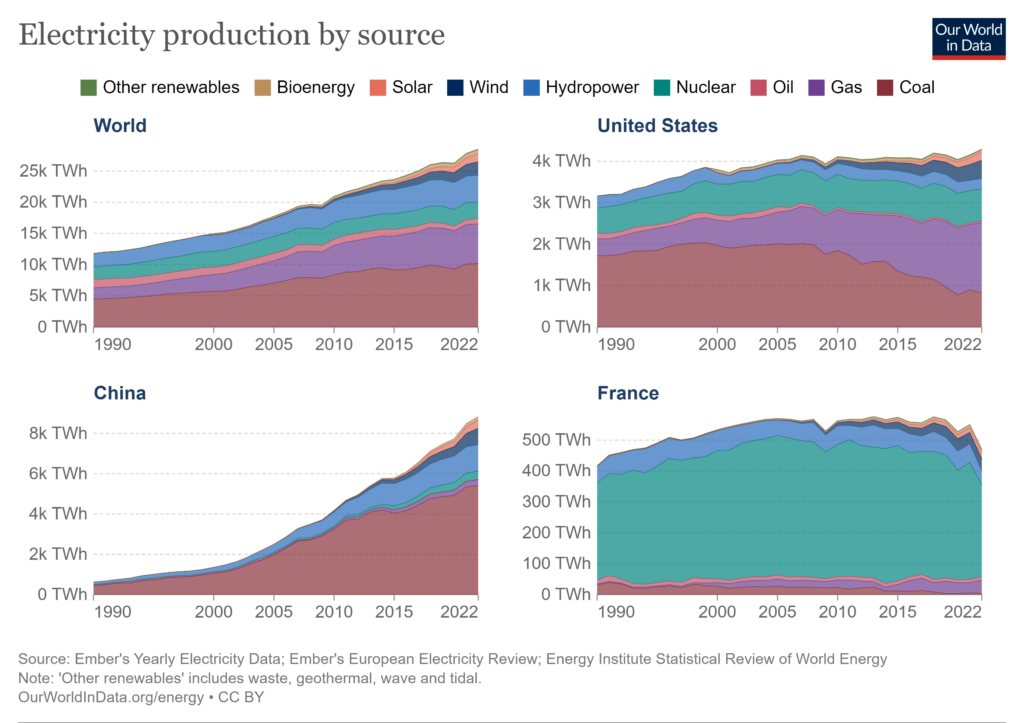
Figure 82: Electricity production by source Credit: Our World in Data[7] WW110
In sum, it looks like the world is mostly meeting new demand for electricity generation through green sources, although China in particular, is building a lot of coal power plants supposedly to back up its variable sources such as hydropower[8]. However, we also need to replace existing fossil fuel electricity generation. It is important to remember that fossil fuels are not free, and every fossil fuel power plant replaced with windmills or solar cells, which have zero input energy costs, results in long term savings. Electricity generation from these renewables is an investment that pays substantial dividends, even without factoring in the climate and health consequences of burning fossil fuels.
The energy sector generates about 3/4 of human greenhouse gases, and electricity generation is key to reductions in that sector. Much of the energy used in transportation (15% of worldwide emissions) can be switched to electricity, and sales of electric cars and plug-in hybrids are increasing. Currently one in seven cars sold globally is electric or a plug-in hybrid, one in four in China[9]. But that means that 6 out of 7 cars sold globally use gas or diesel, and since cars last about 14 years, we have the problem of sunk costs. Transport is not on track to meet climate targets of 1.5 or even 2.0 degrees Celsius.
Two other sectors that use a lot of energy are buildings and construction. While investments in building energy efficiency were a substantial $237 billion in 2021, overall operational emissions from the sector rose because growth in floorspace outpaced efficiency savings[10]. Electrification can help here: the use of heat pumps for heating in addition to cooling eliminates the need to burn fossil fuels. In Sweden, a cool country, 29% of heating is by heat pumps, and in the US about 40% of new housing uses heat pumps. But existing houses, apartments, and condos still need to be converted to meet climate goals. Worldwide there were only about 17 million heat pumps installed in 2021[11]. A 2022 UN report title says simply, “CO2 emissions from buildings and construction hit new high, leaving sector off track to decarbonize by 2050.”
The last main energy consuming sector is industry. Once again, electrification is key, but process changes, efficiency, and new technologies will help. The fossil fuel industry itself is a major contributor to greenhouse gas emissions partly through the venting of methane (also called natural gas) into the atmosphere when extracting oil. Cement production too is a major contributor of CO2 at about 8% of the world total. As with many industrial processes, there are already ways to reduce the carbon footprint of cement production, and more will be found[12]. Under pressure from investors as well as to minimize risk, many companies have pledged to reach net zero emissions by 2050, however I think it is fair to say that most of this is in the planning and research stage.
Finally, there are also greenhouse gas emissions not related to energy, for example the methane released from cow manure and the nitrous oxide released from rice paddy fertilization. Neither of these examples is easy to deal with. “Digesters” exist for managing methane from dung, but there are substantial capital costs, and fertilizer is part of what has made it possible to grow more food on a limited amount of agricultural land. The CO2 reduction curves in Figure 77 show large possible reductions from “reduced conversion of natural ecosystems” and “carbon sequestration in agriculture’ ‘. An American University site explains:
Soils hold three times the amount of carbon currently in the atmosphere or almost four times the amount held in living matter. But over the last 10,000 years, agriculture and land conversion has decreased soil carbon globally by 840 billion metric tons of carbon dioxide (GtCO2), and many cultivated soils have lost 50–70% of their original organic carbon. Because soils have such a large storage capacity, enhancing soil storage by even a few percentage points makes a big difference[13].
One data point: in the US, agricultural emissions have risen by 7% since 1990[14]. Second data point: World agricultural emissions have gone from 5.0 Gigatons in 1990 to 5.79 Gigatons in 2019.
In summary, while there is good news in generating electricity from renewables, and this is extremely important as a first step in the energy sector, the curve of worldwide greenhouse gas emissions is at best flattening. The investment required to bend the curve to where it needs to be to meet emissions targets is quite manageable economically as a fraction of world GDP, but much more needs to be done. The primary barriers to action are political and financial, not technical, and some needed actions will take longer than others in any case. The graphic below shows the projected bend in the emissions curve resulting from currently implemented national policies as well as national targets and pledges under the Paris Agreement (discussed in the next section). The pink “no climate policies” is highly uncertain.
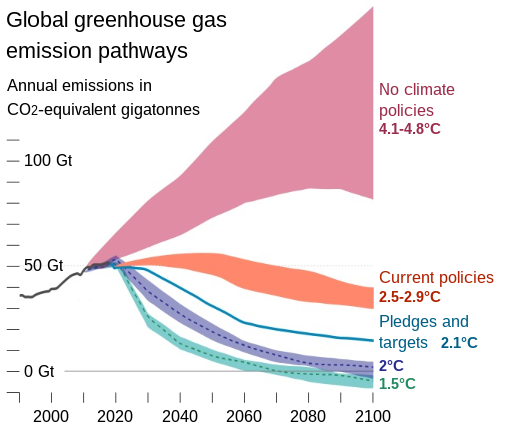
Figure 83: Projected CO2-equivalent emissions. Source: Hannah Ritchie and Max Roser via Wikimedia Commons[15] WW113
The Paris Climate Accords and NDCs
Greenhouse gases know no national borders, and it would be unreasonable to expect any country to make the investment to cut its emissions unless other countries are doing the same. To that end there have been several world climate conferences, the most recent taking place in 2015 in Paris, which resulted in the Paris Climate Accords, also often called the Paris Agreement. Under French guidance, these negotiations avoided some of the pitfalls of earlier negotiations and built on Intended Nationally Determined Contributions which countries submitted prior to the conference. After signing the treaty, these pledges of action to meet climate goals become simply Nationally Determined Contributions, or NDCs. The Paris Agreement is a legally binding treaty which specifies that countries will report their progress and update their NDCs on a regular basis, but the NDCs themselves are not legally binding[16]. The US 2021 NDC for example is simply this: “To achieve an economy-wide target of reducing its net greenhouse gas emissions by 50-52 percent below 2005 levels in 2030.” The rest of the US NDC is an introduction, a brief sector by sector overview of how we intend to reduce emissions, and a section which clarifies the baseline and other items[17]. The whole thing is 24 pages long, so hardly a detailed plan of action, rather an “ambition”. The stated aim of the Paris Agreement was to keep emissions to 1.5°C or “well under” 2.0°C.
How would the world do if all the current NDCs were met? According to Climate Action Tracker, an organization that tracks country emissions, if 2030 targets were met, the world would warm by 2.4° C by 2100, if longer term pledges after 2030 are included, temperature could be kept to 2.0° C above preindustrial levels. Current real-world actions and policies are on track for 2.7°C (4.9°F) by 2100, an increase more than double the current 1.2°C warming[18]. In short, the NDCs aren’t adequate to keep warming below 2.0°C let alone 1.5°C and current implementation is even further off target. But we should point out that temperature increases under business as usual are estimated to be in the catastrophic 3-4° C range.
In addition to the NDCs the Paris Agreement called for a fund to help finance climate mitigation and adaptation in poorer countries. The wealthier countries agreed to contribute $100 billion a year to this fund. As of 2023, contributions are approaching that level but some countries, most notably the US, have contributed much less than their share.
In 2023 the IPCC issued the mandated 5 year “taking stock” report of progress on meeting climate goals, to be followed in November 2023 by COP28, the follow up to COP21, which resulted in the Paris Agreement. This will be a chance for countries to update their NDCs to make them more “ambitious”.
The Climate Action Tracker provides a wealth of detailed information on a country’s targets and pledges under the Paris Agreement as well as implemented policies and actual progress. You can find this info at https://climateactiontracker.org/countries/. The two largest greenhouse gas emitters in the world, China and the US are rated “highly insufficient” and “insufficient” respectively. The US NDC is “almost sufficient” (in short, adequately ambitious) but policies and actions to meet the 2030 target of a 50% reduction are inadequate, although the Inflation Reduction Act did provide a big boost. According to the Climate Action Tracker, China’s emissions are expected to plateau at a high level in 2025 and stay there for the rest of the decade. While China more than meets its NDC for energy production from wind and solar, energy demand has risen at a similar pace and much of current energy production is from coal.
Policies To Get to Net Zero
Getting to Net Zero involves science, engineering, politics and policies. We’ve looked a bit at the science and engineering, and getting most of the way there is both possible and reasonable in cost at scale, even with today’s technology, and newer and less expensive technologies are in the pipeline. That leaves politics and policies, two closely related subjects. Economists love to weigh in on policy.
Carbon Taxes, Subsidies, and Regulations
Greenhouse gases are a classic externality in economics as we’ve mentioned. If you want to choose whether to generate electricity from coal or wind, the waste from coal in the form of CO2 doesn’t figure into the accounting. If you had to pay, say $100 per ton of CO2, for waste disposal, maybe by capturing the CO2 and burying it, the calculation becomes quite different. In the case of burning fossil fuels, there are additional externalities: the particulates in the gases that go up the smokestack have health consequences which can be quantified. In theory most economists favor market mechanisms for dealing with externalities. If we could say precisely that a ton of CO2 emitted from burning fossil fuels resulted in $100/ton of climate related damage and $50/ton of health consequences, we could simply add these to the price of burning the fuels and the free market would deal with it. In the case of generating power from a coal plant versus windmills, a tax of $150/ton on emitted CO2 would even the scales so to speak, and the power company would minimize costs by choosing the lower cost option. Even if coal still came out cheaper (it wouldn’t), the money raised by the $150 per ton tax on CO2 could be used to abate or compensate for the climate and health consequences. In general, such a tax would result in a lot of research and investment in alternative technologies.
Interestingly, in the US back in the day, some Republicans favored a carbon tax because it is a free-market mechanism and requires less bureaucracy than a cap-and-trade system. But from a political perspective anything that can be called a tax, even if revenue neutral, is a difficult proposition in the US[19]. In addition, climate damage is cumulative, the damage from a rise of 5°C is not five times the damage from 1°C, in fact it may be completely catastrophic. There is also the problem of the short window within which we need to accomplish the required GHG reductions. Carbon taxes usually increase automatically over time so that the lowest cost abatements happen first while allowing time for technology to tackle higher cost abatements. Still, the blunt tool of a carbon tax probably cannot guarantee we meet targets on time by itself, even where politically feasible, although it would help enormously.
Another way to achieve GHG reductions using market mechanisms is “cap and trade”. In a typical cap and trade system, a government (country, state) issues CO2 allowances. Each allowance allows the owner to emit a ton of CO2 and is good for one year. Companies either bid for these allowances or are given them, either way they have to have enough to cover their emissions for a year. At the end of the year, companies have to show they have sufficient allowances to match their emissions or pay a penalty. The “trade” part of cap and trade is a market where companies can sell allowances to other companies. If a company can figure a way to reduce its emissions it can sell some of its allowances, and another company can buy and “bank” them against future emissions. Why would a company “bank” allowances? Every year the total number of allowances issued goes down to meet GHG reduction goals, and a company which faces high costs of abatement currently, will find it less expensive to buy and save allowances than to reduce emissions. In this way the market drives emissions reductions with the least expensive reductions happening first.
Cap and trade and carbon taxes are both market based. A carbon tax directly sets the price of emitting greenhouse gases, while a cap-and-trade system, by limiting the supply of allowances, drives their price up as well. In both cases it is the cost of emitting greenhouse gases that drives reductions. But while a carbon tax is universal, cap and trade can only be applied to major emitters because of the complexities of administration – imagine if you had to buy allowances to cover the cost of the CO2 you emit by driving and heating your house. That said, in California which has a cap-and-trade system, 80% of greenhouse gas emissions are covered, while companion programs achieve reductions in areas not covered by cap and trade[20].
The European Union has a long-established cap and trade system which both auctions allowances in the power sector and gives free allowances to other industries such as manufacturing with the number of free allowances declining from year to year. In 2022 the EU allowance price rose to an average of $83 a ton of CO2e and, worldwide, allowance sales amounted to $63 billion[21].
Carbon pricing, either through a carbon tax, or through a cap-and-trade system, can be very effective when an industry, say energy generation, is “carbon intensive”. The same is somewhat true of consumers: the oil price increases of the early 1970’s spurred the development and sales of high gas mileage cars[22]. The opposite, carrots versus sticks, way to use pricing and markets to spur private innovation and investment is for a government to provide subsidies. In the US, the Inflation Reduction Act provides large subsidies to encourage businesses and homeowners to reduce emissions, mostly through tax credits. For example, for clean energy generation projects, companies can get a 2.75 cents per kilowatt hour production tax credit, meaning that they can take that amount off their taxes for every kilowatt generated. Since the cost of generating electricity with natural gas, say, is comparable with wind at about 4 cents a kilowatt hour, this is quite a significant subsidy and tilts the playing field to clean energy production[23]. Subsidies are an easier sell politically and can be combined with other policy objectives. The Inflation Reduction Act subsidies favor domestically produced electric cars for example. Also, in many cases buyers respond more to the upfront cost of a purchase than its life cycle cost. If an electric car costs $10,000 more than a comparable gas-powered car, a buyer may not buy it even if the electric car’s life cycle cost is considerably less than the gas powered one when fuel, maintenance, and longevity are considered. In such cases a subsidy on the initial purchase price of the car works better than a carbon tax on gasoline[24]. Of course, carbon taxes and subsidies can be combined.
There are times when taxes and subsidies don’t work well. A home builder may choose to put in a gas furnace because it’s cheaper than an electric heat pump and it’s the homeowner who will be paying for the gas. In such cases, regulations are needed. Home building regulations, also known as local building codes, have long specified the insulation levels for walls and windows, and one that specifies that heating and cooling not use fossil fuels is simple to add.
In short there are many levers that governments can operate to reduce GHG emissions. More recently large companies have gotten involved in lobbying for climate action and in “greening” their own operations. Very little of the huge surpluses the oil companies have been making have gone into green investment according to the IEA[25], but other companies have realized that uncertainty over climate change is a significant risk factor when planning investment. Obviously, insurance companies are terrified, but the concern is not limited to them and a group of 131 companies with annual sales of a trillion dollars recently urged quicker phaseout of carbon fuels[26].
Importance of Scale and Industrial Policy
The falling cost of solar cells is no accident. While the technology was largely developed in the US, China essentially owns the market. How did that happen? It’s an interesting story[27]. The Germans and then Spain and Italy instituted major financial incentives for generating solar power starting in the 2000’s and were overwhelmed by demand. China saw the opportunity to sell solar cells at scale to these countries, and at the same time build a high-tech industry. They bought foreign solar companies and invited others to move to China, where they found cheap, skilled labor and received tax credits. Most of the cost reduction in recent years has been from economies of scale which require very large factories, and China put up $47 billion in financing to help companies build large semi-automated plants. Finally, when supply capacity caught up with demand from abroad, China started its own program of buying solar energy at generous prices to build up its solar energy generation capacity. In the meantime, US solar companies found it impossible to compete with the prices of Chinese solar cells.
In short, China did what any well-run company would do: saw a market direction and opportunity and invested heavily in it. That is an industrial policy success story. The larger story of solar is one of governments purchasing technology at scale to kick start an industry and drive down prices through innovation and scale.
Carbon Offsets
Delta Airlines claims to be “the world’s first carbon-neutral airline”. Electric planes don’t exist, so how can Delta be carbon neutral?
In many carbon trading schemes, a company can buy carbon credits to balance out its emissions. A carbon credit is earned when a ton of CO2 that would go into the atmosphere is somehow saved. If a company “saves” as much CO2 emission as it causes, it can claim carbon neutrality. One of the main sources of carbon credits is “preventing” deforestation of the Amazon and works simply by paying someone not to chop down and burn the trees. The market for these offsets is largely unregulated and an investigation found that “Verra rainforest credits used by Disney, Shell, Gucci and other big corporations were largely worthless, often based on stopping the destruction of rainforests that were not threatened, according to independent studies.”[28]
Of course, real carbon offsets do exist. Delta and Shell could pay to install verifiable direct carbon capture and sequestration on difficult to abate sources, but of course this would cost much more. In any case the numerous problems with voluntary carbon credits suggest they should simply be eliminated or at least limited to verifiable and regulated emissions reductions, probably with a minimum price well above $100/ton and adjusted upward over time.
Engineering Cost Estimates vs Real World Behavior
The abatement curves we looked at earlier are based on the then-current engineering cost estimates of abating a ton of CO2e. Economists have pointed out that some of these estimates are unrealistic given real-world behavior and, in some cases, don’t accord well with empirical studies. For example, while the abatement curves show that residential insulation retrofit saves money and thus costs less than zero per ton of CO2 saved, one comprehensive study of a free program of residential weatherization concludes that it actually costs around $350 per ton of CO2 saved[29].
This is not an argument for not trying, but rather an argument for broad market-based approaches, for not tying programs to technologies but rather results, and for evaluating real world costs and effectiveness[30].
[1]https://about.bnef.com/blog/renewable-energy-investment-hits-record-breaking-358-billion-in-1h-2023/
[2] IEA, Power investment, 2019-2023, IEA, Paris https://www.iea.org/data-and-statistics/charts/power-investment-2019-2023, IEA. License: CC BY 4.0
[3] https://about.bnef.com/blog/renewable-energy-investment-hits-record-breaking-358-billion-in-1h-2023/
[4] https://www.carbonbrief.org/analysis-chinas-co2-emissions-hit-q1-record-high-after-4-rise-in-early-2023/
[5] https://www.iea.org/reports/hydropower-special-market-report/executive-summary
[6] https://world-nuclear.org/information-library/current-and-future-generation/plans-for-new-reactors-worldwide.aspx
[7] https://ourworldindata.org/electricity-mix
[8] It may seem odd to call hydropower variable, but a drought in China reduced the level of hydropower drastically in 2022. See https://www.reuters.com/business/energy/chinas-new-coal-plants-set-become-costly-second-fiddle-renewables-2023-03-22/
[9] https://www.weforum.org/agenda/2023/03/ev-car-sales-energy-environment-gas/
[10] https://www.unep.org/news-and-stories/press-release/co2-emissions-buildings-and-construction-hit-new-high-leaving-sector#:~:text=Key%20global%20trends,2015%20to%20152%20in%202021.
[11] https://www.greenmatch.co.uk/blog/global-heat-pump-statistics
[12] See for examples https://psci.princeton.edu/tips/2020/11/3/cement-and-concrete-the-environmental-impact.
[13] https://www.american.edu/sis/centers/carbon-removal/fact-sheet-soil-carbon-sequestration.cfm#:~:text=What%20is%20Soil%20Carbon%20Sequestration,absorb%20and%20hold%20more%20carbon.
[14] https://epa.gov/ghgemissions/sources-greenhouse-gas-emissions#agriculture
[15] This graphic more or less concurs with IPCC AR6 Figure 2.5. Full attribution Hannah Ritchie and Max Roser, adapted for svg and smartphone by Eric Fisk, CC BY-SA 4.0 <https://creativecommons.org/licenses/by-sa/4.0>, via Wikimedia Commons
[16] The US objected to the word “shall” which implies legal binding, and the word “should” was applied to meeting NDC targets.
[17] https://unfccc.int/sites/default/files/NDC/2022-06/United%20States%20NDC%20April%2021%202021%20Final.pdf
[18] https://climateactiontracker.org/global/cat-thermometer/
[19] The entrenched fossil fuel interests have virtually unlimited money with which to influence public opinion and political will.
[20] https://ww2.arb.ca.gov/resources/documents/faq-cap-and-trade-program#:~:text=If%20an%20emitting%20entity%20covered,times%20whatever%20is%20still%20owed.
[21] https://www.reuters.com/business/sustainable-business/record-63-billion-raised-carbon-allowance-sales-2023-report-2023-03-22/
[22] For a while anyway until prices moderated. Also partly due to the CAFE standards https://www.pewtrusts.org/~/media/assets/2011/04/history-of-fuel-economy-clean-energy-factsheet.pdf
[23] A detailed but accessible guide to the IRA can be found at https://www.whitehouse.gov/wp-content/uploads/2022/12/Inflation-Reduction-Act-Guidebook.pdf. There are briefer summaries such as https://www.epi.org/blog/the-inflation-reduction-act-finally-gave-the-u-s-a-real-climate-change-policy/#:~:text=The%20dominant%20strategy%20the%20IRA,lead%20to%20reduced%20GHG%20emissions.
[24] The IRA rules on this are a complex mess and the choice of a “nonrefundable” tax credit for vehicles means that lower income people can’t partake.
[25] Much of it is going into dividends and stock buybacks and also debt service. See https://www.iea.org/reports/world-energy-investment-2023/overview-and-key-findings.
[26] https://www.reuters.com/sustainability/cop/nestle-volvo-among-130-companies-urging-cop28-agreement-ditch-fossil-fuels-2023-10-23/#:~:text=Nestle%2C%20Volvo%20among%20130%20companies%20urging%20COP28%20agreement%20to%20ditch%20fossil%20fuels,-By%20Tommy%20Wilkes&text=LONDON%2C%20Oct%2023%20(Reuters),to%20phase%20out%20fossil%20fuels.
[27] An overview is provided in a Scientific American article at https://www.scientificamerican.com/article/why-china-is-dominating-the-solar-industry/
[28] https://www.theguardian.com/environment/2023/may/30/delta-air-lines-lawsuit-carbon-neutrality-aoe
[29] https://www.sciencedirect.com/science/article/abs/pii/S0301421518301836 (click View Open Manuscript)
[30] For the range of costs of climate interventions and policies per ton of CO2e abated extracted from the economics literature, see Gillingham et al in “The Cost of Reducing Greenhouse Gas Emissions.” at https://www.aeaweb.org/articles?id=10.1257/jep.32.4.53.
