Productivity Growth Worldwide Distribution
The map below shows the current GDP per capita of countries around the world. GDP per capita provides a good indication of relative labor productivity in the money (as opposed to barter or unofficial) economy. GDP for each country has been adjusted to account for differences in local purchasing power[14].
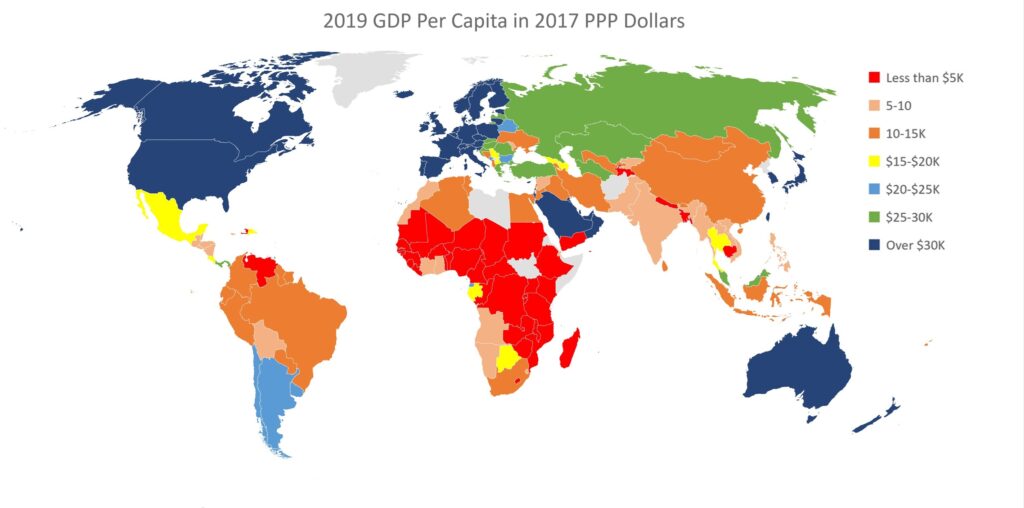
Figure 22: 2019 GDP Per Capita in 2017 Purchasing Power Parity (PPP) Dollars. Data Source: Penn World Tables. WW156
If one looks instead at the growth rate of GDP by country in the map below, a contrasting picture emerges. Growth has been slow in richer countries including the US, Canada, Europe, and Australia, and higher as predicted in many poorer countries, such as China and Southeast Asia. However, some very poor countries have also had slow or non-existent growth since 1990. Countries with negative per capita growth over the period, shown in red, include the Democratic Republic of the Congo and Venezuela, which illustrate the disastrous economic effects of war and turmoil.
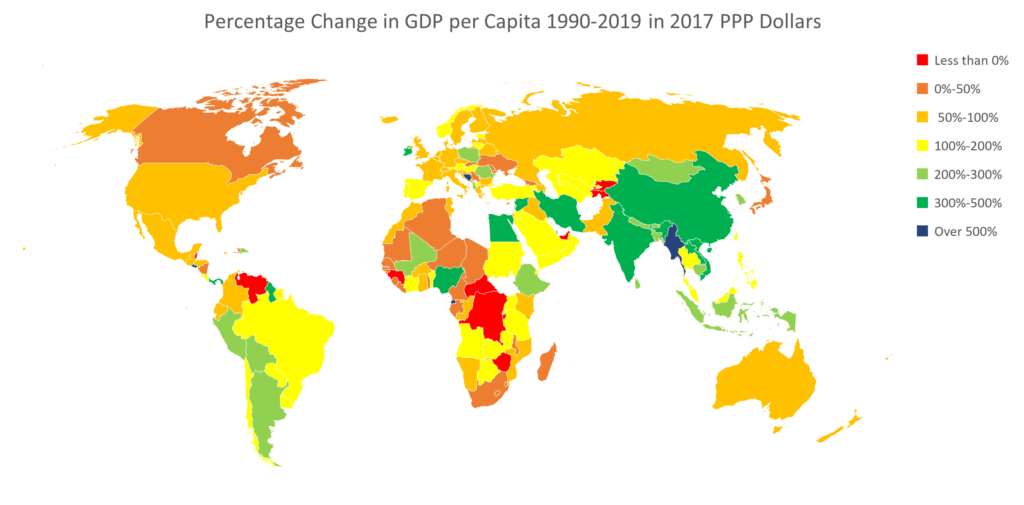
Figure 23: Growth in GDP per Capita in 2017 purchasing power dollars from 1990-2019. Source: Penn World Tables. WW157
We’ve seen that in China, agricultural productivity growth freed people to work in industries fueled by trade and financed by foreign investors. It is worth looking a bit more at how agricultural productivity has grown in the developing world.
Worldwide, agriculture still accounts for 27% of employment but only 4% of GDP, a fact which underlies the relationship between poverty (as measured by GDP) and widespread subsistence agriculture. Despite the advances of the Green Revolution, about 9 million people still die of malnutrition annually[15]. That said, increased agricultural productivity worldwide reduced the fraction of the world’s population that is undernourished from 35% in 1970 to 13% in 2017 despite population doubling in that time period [16].
In the developing world, agricultural productivity growth varies by country and region. Growth of agricultural output is actually similar in Africa and China, for example, but labor and total factor productivity in agriculture has stagnated in Africa. Why?
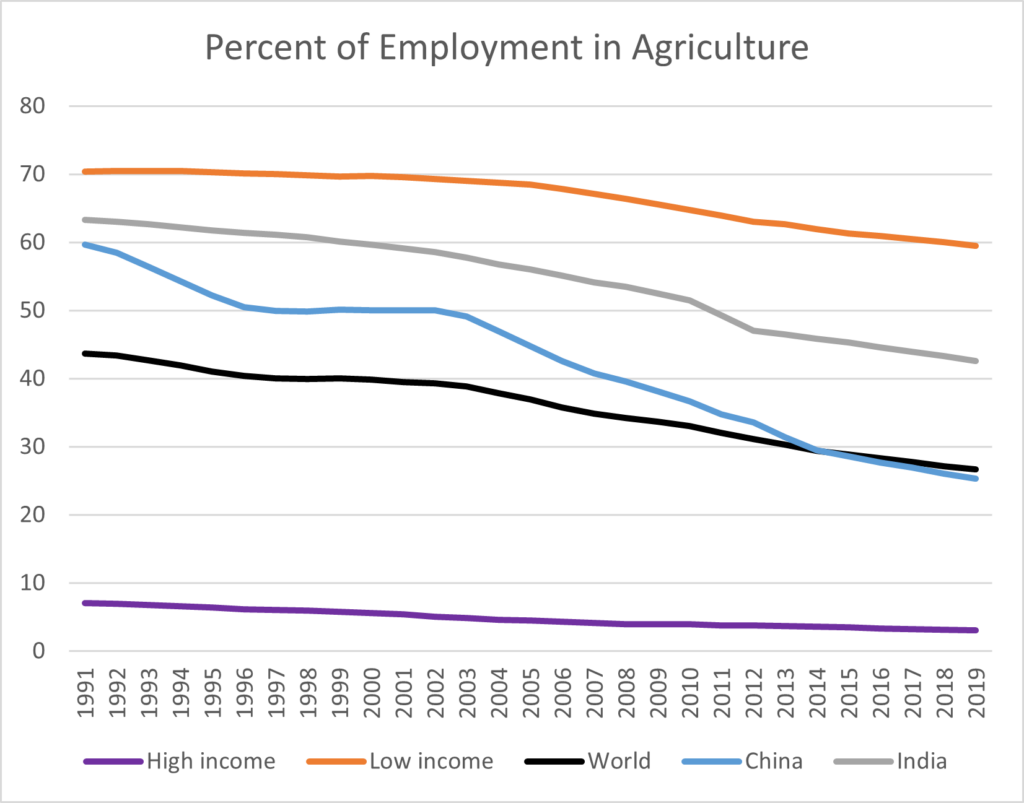
Figure 24: World employment in agriculture in 2019. Source: World Bank and International Labor Organization. WW158
In China, agricultural employment has fallen from 60% of the working population to about 25% since 1991 as shown on the chart. It’s not just that people have migrated to cities: rural non-farm employment rose from 30 million in 1978 to over 200 million in 2007, and more than half of rural income now comes from non-farm employment[17]. Along with abandoning collectivized agriculture, this influx of money has encouraged farmers to invest in equipment and fertilizer and better crop varieties. The growth of agricultural productivity in China is all a story of increasing labor productivity, and more modestly yield increases, on the approximately 10% of the country that is farmable, rather than farming more cropland. In addition, there has been an increase in the production of meat. In contrast, in Sub Saharan Africa, much of the substantial increase in agricultural production has come through increases in land under cultivation. Labor productivity in African agriculture has changed little, in part because, despite rapid growth in urban areas, population growth is so high that agriculture still accounts for more than 50% of employment, primarily on small family farms[18]. Sub Saharan Africa’s population has grown fivefold since 1960, compared to about doubling in China and tripling in India.
The charts below show how China has increased agricultural output by applying more capital and fertilizer while using the same amount of land and less labor. In Sub-Saharan Africa, on the other hand, increasing output has required using more land and labor to barely keep pace with an increasing population.
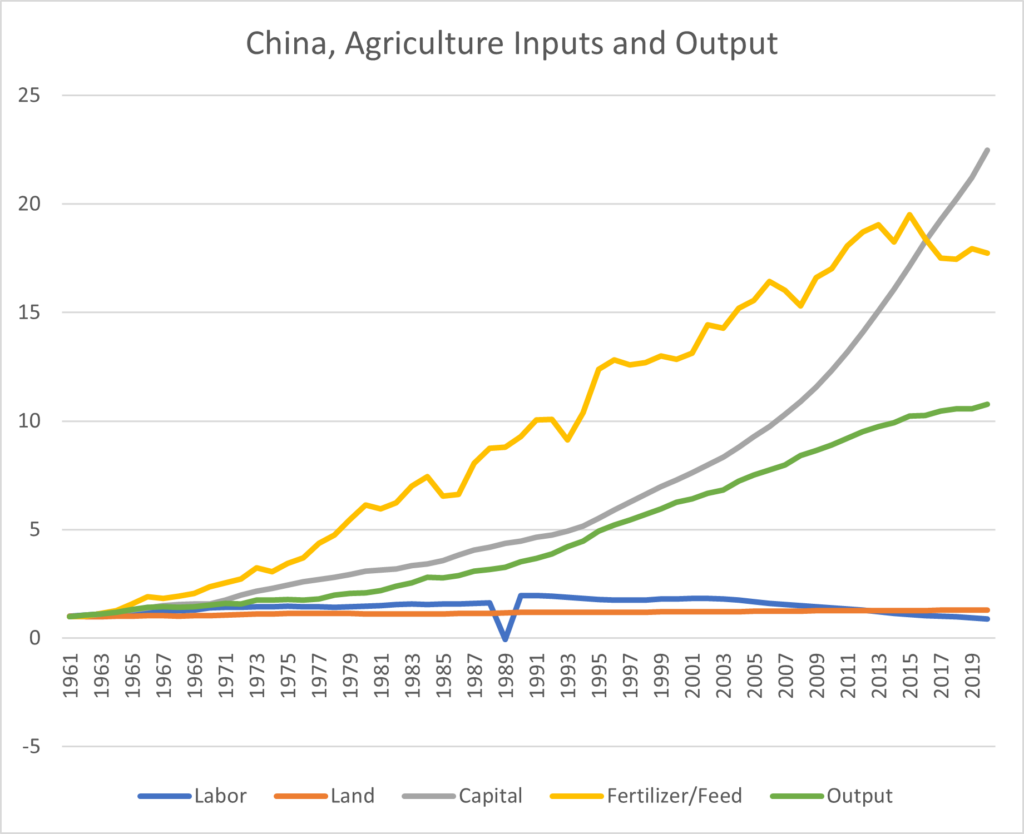
Figure 25: China, Agricultural Inputs and Outputs. Chart shows the growth in each with 1961=1. For example, 20 times as much fertilizer is now used on roughly the same amount of land. Source: US Department of Agriculture World TFP Data. WW159
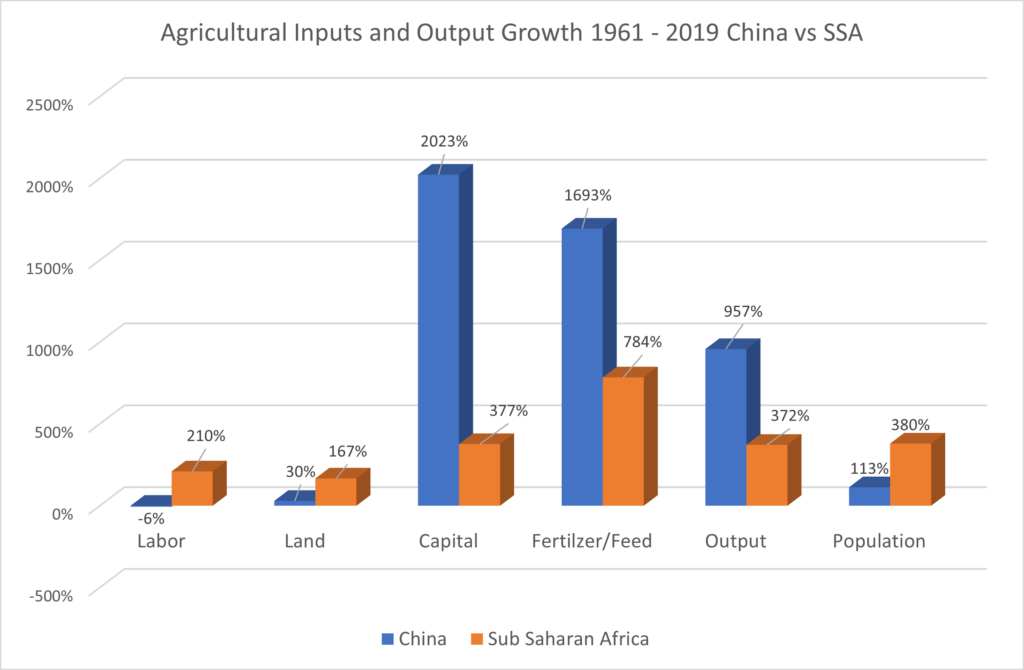
Figure 26: Agricultural Inputs and Output Growth 1961 – 2019 China vs Sub-Saharan Africa. Source: US Department of Agriculture World TFP Data. WW160
In both Africa and India capital accumulation and foreign investment have not been able to provide enough jobs to keep up with the growth in population, and young people unable to find other work end up working on inefficient family farms[19]. In low-income countries, agricultural productivity and scale production are affected as well by a lack of infrastructure and capital investment. In Nigeria, 45 percent of fresh produce rots due to the lack of refrigeration. Globally, 1.3 billion tons of perishable food goes to waste each year because of lack of proper post-harvest storage, almost all of it in poor countries[20].
Improvement in agricultural productivity and the growth of the industrial and service sectors are closely linked in a chicken and egg way. In low-income countries, agricultural productivity is still quite low, and shifting employment from agriculture to other sectors is the fastest way to improve overall productivity. As we saw in the case of China, profits from trade in manufactured goods can then finance further development in a positive feedback loop, and, as long as large income disparities exist in the world, it is possible for other countries to follow this growth model. As we’ll see in the section on trade, as incomes have risen in China, much textile production has shifted to other countries such as Bangladesh, a poor country with an accelerating rate of GDP per capita growth.
Unfortunately, productivity growth is not guaranteed unconditionally for developing countries. In addition to the factors we noted earlier including stable government, low levels of corruption, and higher levels of education, World Bank case studies highlight the importance of export promotion, global value chain integration, and foreign direct investment (FDI) in transitioning to higher-productivity growth. But the authors also note that this development strategy hasn’t always worked and there are indications that manufacturing led growth may be more difficult now:
“[Developing countries] that have successfully shifted into higher-level productivity clubs have often relied upon manufacturing- led development—efforts to enhance the complexity and diversity of exports can prove to have high rewards but have also frequently been costly failures. This strategy faces increasing challenges due to falling global manufacturing employment and slower trade growth.[21]”
Trade has been key in development success, particularly trade in manufactured items rather than commodities. Trade, as we’ve seen in the case of China, is often a story of foreign companies seeking to lower costs by sourcing manufacturing and tradable services in countries with lower labor costs. The resulting foreign investment helps build up the country’s capital stock and educated workforce, setting the stage for rapid productivity growth. The form of government doesn’t seem to be as important as stability, at least a partially free market, and openness to trade. Economic development is, perhaps paradoxically, key to sustainability. Continued growth of the human population past 10 billion is widely acknowledged to be unsustainable, and the only sure-fire method of reducing the birthrate we know of, aside from coercion, is by improving standards of living[22]. We’ve seen that trade is an important factor in helping developing countries grow their productivity and GDP. The next section looks at the scale and economic effects of international trade.
[14] Purchasing Power Parity, or PPP, adjusts for the fact that $10 converted to a country’s native currency using market exchange rates may buy more consumer type goods than the same $10 would in the USA.
[15] https://borgenproject.org/15-world-hunger-statistics/. India has the largest number of malnutrition deaths.
[16] https://ourworldindata.org/hunger-and-undernourishment
[17] Bryan Lohmar, Fred Gale, Francis Tuan, and Jim Hansen. 2009. “China’s Ongoing Agricultural Modernization.” USDA Economic Information Bulletin Number 51, April. https://www.ers.usda.gov/webdocs/publications/44377/eib-51.pdf?v=0.
[18] Zuma-Chair, Nkosazana Dlamini. 2014. “Agriculture in Africa.” African Union – New Partnership for Africa’s Development. https://www.un.org/africarenewal/sites/www.un.org.africarenewal/files/Agriculture%20in%20Africa.pdf.
[19] For the situation in Africa, see the prior citation. In India the “demographic dividend” downside is discussed in Jha, Somesh. 2023. “World’s Largest Population: Will India Gain or Lose?” Al Jazeera. April 18, 2023. https://www.aljazeera.com/features/2023/4/18/overtaking-chinas-population-will-india-gain-or-lose.
[20] https://foreignpolicy.com/2022/11/06/climate-cop27-emissions-adaptation-development-energy-africa-developing-countries-global-south/?utm_source=PostUp&utm_medium=email&utm_campaign=Flashpoints%20OC&utm_term=57271&tpcc=Flashpoints%20OC
[21] World Bank Group. 2022. “Global Productivity: Trends, Drivers, and Policies.” World Bank Group. https://www.worldbank.org/en/research/publication/global-productivity. Page 204
[22] We will discuss that topic in the section on sustainability.
