“Goods production” in US statistics includes mining, construction, and manufacturing. Some international statistics use “industry” instead. In any case construction has maintained a fairly steady share of employment, while the much larger manufacturing sector accounts for almost all of the decline in goods employment relative to services. When we refer to the “goods producing” or “industrial” sector, think “manufacturing”.
Here again is the chart showing percentages of employment in the US “goods producing” sector for the years 1960, 2010, and 2020.
Table 2: Goods Producing Employment Source: Bureau of Labor Statistics
* If 2020 percentages of employment had been the same as 1960
The huge decline in manufacturing as a percentage of total employment has already been pointed out and is well known. We have advanced three possible contributing factors: (1) higher relative labor productivity growth in manufacturing resulted in lower labor requirements, (2) imports and the trade deficit in manufactured goods suppressed employment in that sector, (3) a decline in demand for manufactured goods relative to services shifted employment from manufacturing to services.
There are hundreds of economic studies addressing these factors. Here we will look at the first, has manufacturing productivity grown relative to other sectors?
Unfortunately, it is not as easy to calculate productivity increases in many manufacturing sectors as it is in agriculture. While in agriculture output can be measured directly in, say bushels of wheat, in manufacturing output is almost always measured in dollar terms of “value added”. In assembling a Ford F150 truck for example, there are a mix of intermediate inputs over time, some of them from overseas, and it would hardly make any sense to look at “labor hours” to “assemble a car” without accounting for the intermediate inputs. Furthermore, the final output varies over time. A Ford F150 now contains a lot more electronics than the 1997 model so, when computing value-added, statisticians adjust the output value to recognize that the current model has more features. Of course, all dollar values also have to be adjusted for the product’s price changes in order to be comparable over time. If we want to compare the quantity of an item produced, and start with sales figures, we have to know its price. In addition, when coming up with an overall “manufacturing” productivity number, one has to group together many industries, which may have quite different productivity changes over time, and include new products.
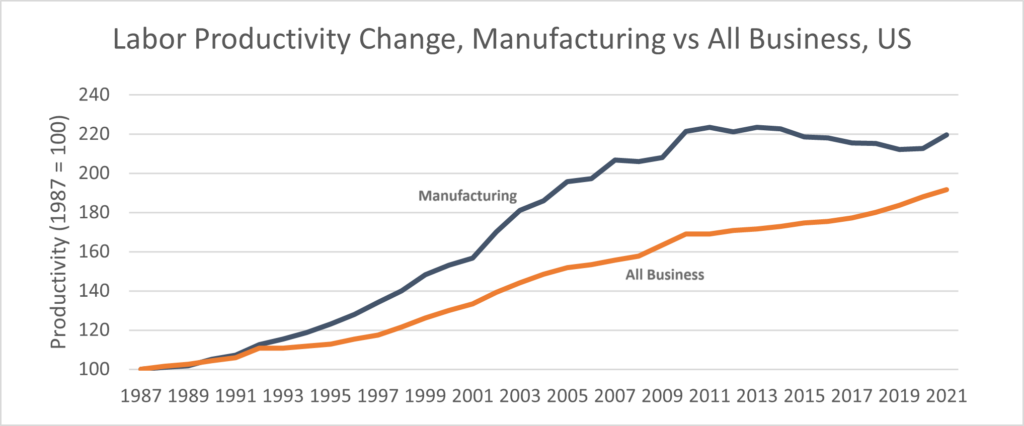
Despite these difficulties, economists generally agree that after the second world war until about 2010 manufacturing labor productivity increases in the US were higher than for the economy as a whole, and services in particular. In “Rising Tide, Is Growth in Emerging Economies Good for the United States?” the authors estimate that “value added per person employed grew by 3.3 percent per year from 1960 to 2007 in manufacturing, compared to only 1.6 percent per year for the economy as a whole.”[1] Other authors come up with lower numbers, and official US numbers from 1987 through 2019 show that manufacturing labor productivity grew more than overall business productivity, 220% vs 192% over the period as shown in the Bureau of Labor Statistics data below[2].

Figure 11 – Labor Productivity, Manufacturing vs All Business. BLS Series PRS30006093 and PRS84006093. WW149

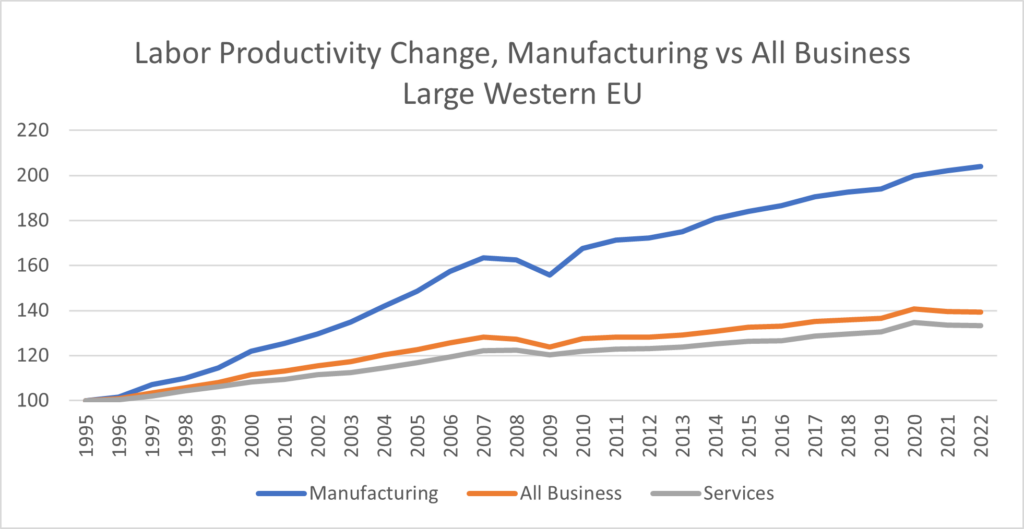
Figure 12 Chart: Labor Productivity Change, Manufacturing vs All Nonfarm Business Sources: US BLS series PRS30006093 and OECD Dataset: Productivity and ULC by main economic activity (ISIC Rev.4). WW150
The peculiar hump in the US manufacturing productivity statistics shown above has given rise to some anxiety over a possible slowdown in growth[3], but others see it as a fluke related to the way computers were valued in earlier statistics, and possibly also the general economic weakness and stagnant wages after the 2008 recession[4]. The growth in manufacturing productivity in large European Union countries such as Germany and France is quite similar to the US in the last few decades.
We can see that higher productivity growth in manufacturing is an important factor in reducing employment in that sector relative to the services sector.
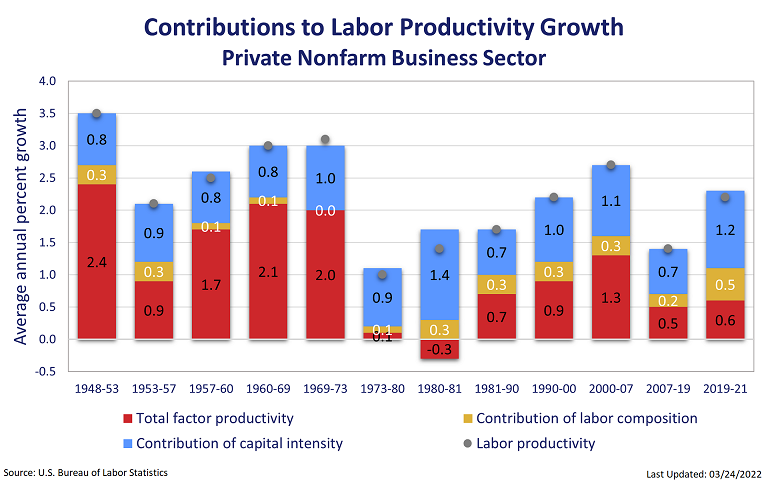
What is driving the increases in productivity in manufacturing? The chart below shows the overall size of productivity growth over time in the US and the contributing factors. This is not just for the manufacturing sector, but other sources corroborate that these apply to that sector[5].

Figure 13 : Contributions to US Labor Productivity Growth. Source: BLS OPM Program, an updated version of this chart can be found at https://www.bls.gov/productivity/graphics/2022/graphic-3.htm WW115
Until about 1973, the major contributor to US labor productivity increase was “total factor productivity” which is a measure of output increases that cannot be attributed to increases in capital, labor, or other inputs. If you can produce more output without increasing inputs, you have increased total factor productivity. Prime contributors to total factor productivity include improved technology, economies of scale, better management, and a suitably skilled workforce. In turn improved technology is a product of investing in research and education, the scale of production is often dependent on infrastructure, and of course a suitably skilled workforce requires education. The next biggest contributor to labor productivity increases shown is capital intensity, which measures capital resources per worker. If workers are replaced by machines, the labor productivity of the remaining workers goes up since less labor is required to produce the same output. The final contributor shown on the chart is labor composition. Labor composition refers to the skill level of workers and goes hand in hand with technological improvements, and more capital equipment but can be an independent factor as well.
Since 1973 US labor productivity has been driven less by total factor productivity increases, including technology change, than by increased capital intensity, i.e. substituting capital for labor. Overall, year on year, labor productivity increases have been lower since 1973 than in prior decades.
The box below describes a couple of real-world manufacturing processes which shed light on why this might be the case for manufacturing. .
| A Couple of Real-World Goods Producing Stories The TV show “Food Factory” offers a fascinating glimpse into how foods are produced. In Season 4 episode 9 one segment is about Hershey’s kisses and another about the production of multicolored gummy rainforest tree frogs. Both foods are produced, wrapped, and packaged almost entirely by machine with a few workers required to monitor the machines, add raw ingredients and the like. At the final stage of placing the boxes on a pallet and wrapping the entire pallet in plastic, the Hershey’s plant has a machine that performs that function while the gummy frog plant does that manually. Simply put, the cost of the machines required for this last step make sense for the high-volume kisses plant but not for the lower volume gummy frogs one. This segment illustrates several things about manufacturing productivity now: Many factories are already automated to a high degree, so that the cost of labor is not a major factor.While further automation is possible it may not make economic sense Newer technologies such as robotics will not significantly improve the labor productivity of already fully automated processes which often use technology that was available by the 1970’s or before. In contrast to the food factories, the automotive industry is the largest customer for industrial robots. Automated welding machines were introduced in the 1960’s and currently robots do almost all the body assembly, welding, and painting of car bodies. However much of the rest of the assembly is done by humans on an assembly line which would seem familiar to Henry Ford. Tesla tried to increase automation at its Freemont, CA plant but had to tear out some robots and go back to manual assembly. Elon Musk agreed that, even though robots are helpful, “excessive automation at Tesla was a mistake.” “Humans are underrated.” he added. The main difference between the food factory automation and auto assembly automation has to do with adaptability. The food factory machines are single purpose and for the most part could not be adapted to produce a different food product, while the automotive industrial robots, such as welders, can be reprogrammed as needed to produce different models. The artificial intelligence and dexterity at the level required to replace humans in many production processes is still evolving. It now takes about 20 hours of labor to assemble a car from the intermediate components. At current pay scales, that is less than $1000 including benefits and overhead, so cost savings from further automation are limited. That said, we’re likely to see a considerable increase in labor productivity associated with producing “a car” as we move from gas powered vehicles to electric ones. Electric cars use about half as many parts as gas ones, 15,000 as opposed to 30,000, and have only about 20 moving parts. That means fewer workers will be needed to build parts for, and assemble, these cars. There have already been layoffs announced in Germany and Japan ascribed to the coming technology switch. |
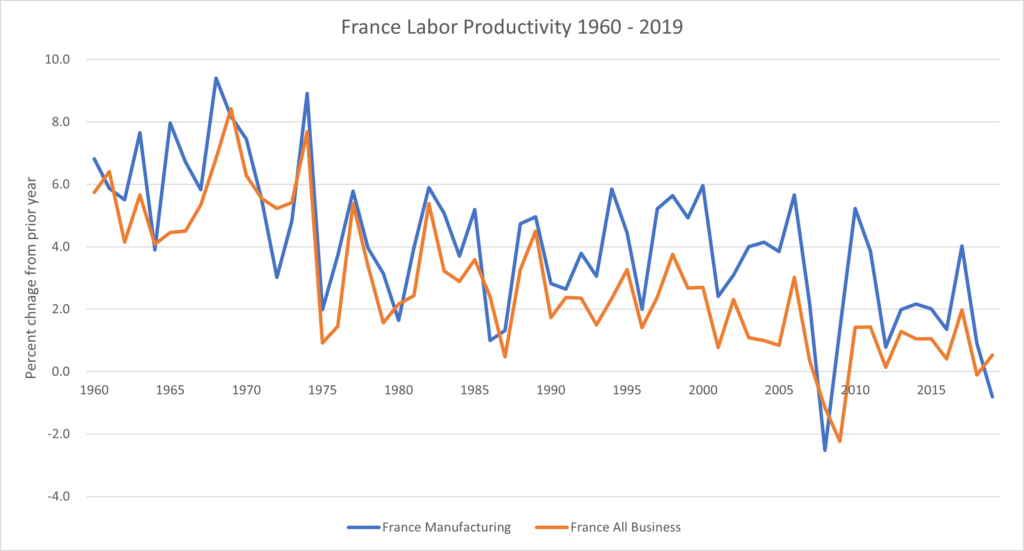
Before we leave the subject of productivity growth in goods production in advanced economy countries, let’s take a look at France which has gathered statistics on manufacturing productivity since way before most other countries.

Figure 14 – OECD Dataset: Productivity and ULC by main economic activity (ISIC Rev.4). WW151
Here are the averages:
Table 3 – France average productivity increase year on year
| Average increase 1960-2019 | Average increase 1960-1999 | Average increase 2000-2019 | |
| Manufacturing | 4.1 | 4.9 | 2.6 |
| All Business | 2.8 | 3.8 | 0.9 |
We can see that in France productivity increases in manufacturing have consistently outpaced “all business” productivity which includes both goods production and services. In fact, the differential in productivity increases in France of 1.3% (manufacturing’s 4.1% minus all business’ 2.8%) over 60 years will produce the relative change in output and employment we’ve seen (roughly a 50% reduction in employment share in manufacturing). In the chart we can also see that productivity increases declined until the early 2000s but since then have been relatively flat.
The picture for goods production in advanced economy countries thus is one of amazing increases in productivity in the 20th century but with smaller increases in the last couple of decades. The employment picture for the last 60 years reflects this increase in productivity in manufacturing, with sharp drops in the percentage of total employment, but stabilizing over the last couple of decades at about 10%.
As to our question about the relative decline in manufacturing jobs, can we say that it is entirely due to greater productivity in manufacturing? Not without looking at the other two possible factors: trade and changes in the mix of demand for manufactured goods versus services. We’ll sum up the evidence after the section on trade. For now, it is highly suggestive that manufacturing employment has fallen sharply in industrialized countries even when they run large trade surpluses, and that even in “developing” countries the ratio of services employment to manufacturing employment is growing. We have simply become very good at making “stuff” and that is really a very good thing.
[1] Edwards, Lawrence, and Robert Z. Lawrence. 2013. Rising Tide, Is Growth in Emerging Economies Good for the United States? Peterson Institute for International Economics. P90
[2] The BLS changed the way it gathers data in 1987 and it is difficult to combine this data with earlier statistics. A number of economists feel that the output value-added the BLS used for computers in this time period was overly inflated by quality adjustment. In short, as computer power increased, the BLS adjusted the output value-added. Without this adjustment growth in manufacturing is much lower. See Baily, Martin Neil, and Barry P. Bosworth. 2014. “US Manufacturing: Understanding Its Past and Its Potential Future.” The Journal of Economic Perspectives: A Journal of the American Economic Association 28 (1): 3–26.
[3] See for example “US Manufacturing Productivity Is Falling, and It’s Cause for Alarm.” 2021. IndustryWeek. July 12, 2021.
[4] When wage pressure is weak, there is less financial incentive to reduce labor costs through automation.
[5] Through 2002, see Aaron E. Cobet and Gregory A. Wilson. 2002. “Comparing 50 Years of Labor Productivity in U.S. and Foreign Manufacturing.” Monthly Labor Review (BLS), June. https://www.bls.gov/opub/mlr/2002/06/art4full.pdf.
