As we’ve just seen, the ongoing industrial revolution, and the concurrent agricultural revolution, have dramatically increased labor productivity in the “advanced economies”. Looking specifically at the United States, it took 80% of the population to grow food in the US in the late 1700’s it takes less than 2% of workers today. Manufacturing in the United States employed over 25% of workers in 1965 and now employs under 10% but still generates about 12% of real GDP[1]. Clearly fewer employees are needed to grow the food and manufacture the items we consume or trade. With less than 12% of the workforce, productivity gains in these two sectors of the economy have had profound effects on employment.
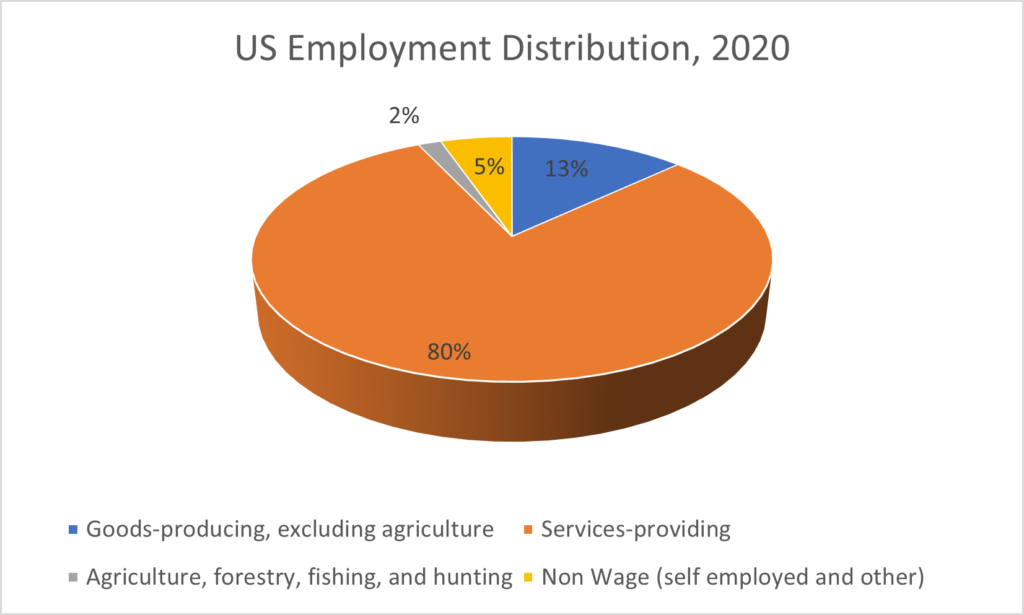
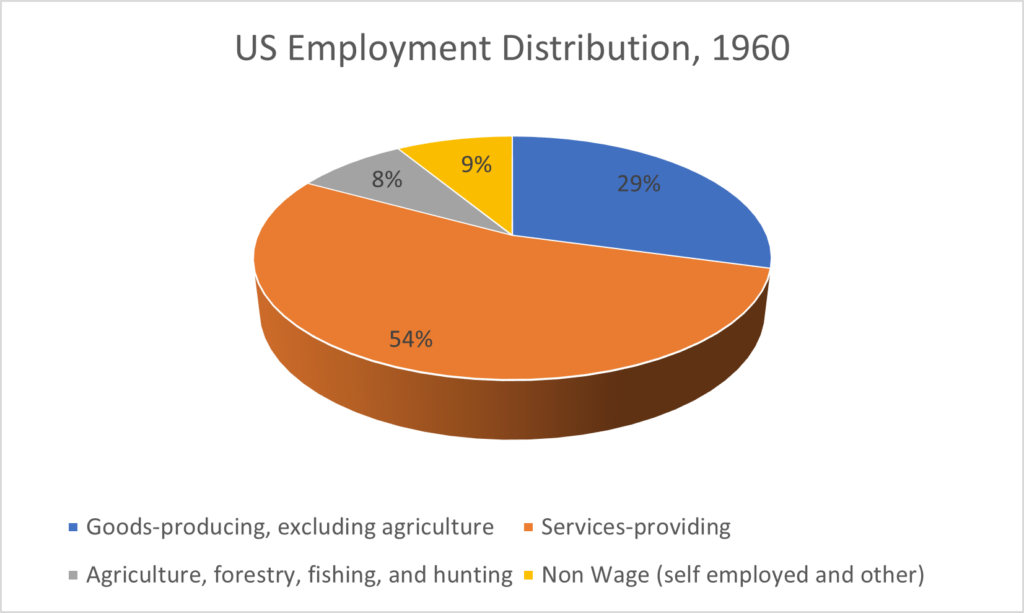
The chart below shows the changes in major sector employment in the US between 1960 and 2020. Goods producing employment, which includes manufacturing, has gone from around 30% of employment in 1960 to about 13% in 2020, and most of that decrease in employment has gone into “service providing” which includes health and education, business and professional services, trade, transportation and state and local government.

Figure 7 US Employment Distribution 2020 (before COVID). Source BEA NIPA Table 6.5 WW116

Figure 8 US Employment Distribution 2020 (before COVID). Source BEA NIPA Table 6.5
A more detailed look at the data shows the dramatic shift from goods producing to service providing, and which major economic sectors gained and lost jobs as a percent of the total. The last column shows how many more, or fewer, jobs each sector would have had in 2020 had the employment percentages stayed the same as they were in 1960. The biggest loser is manufacturing where the decline is 23 million jobs, the biggest gainers are health (13 million jobs) and education and professional services (10 million jobs). Agricultural employment is a tiny percent of the total but has lost 75% of its share of employment since 1960.
Table 1: Change in US Employment by Major Sector, 1960 to 2020
| Industry Sector | % of Employees 1960 | % of Employees2010 | % of Employees2020 | % Chg 1960 – 2020 | Jobs lost/gained millions* |
| Agriculture, forestry, fishing, and hunting | 8% | 2% | 2% | -80% | -9.5 |
| Goods-producing, excluding agriculture | 29% | 13% | 13% | -56% | -23.2 |
| Mining | 1% | 1% | 0% | -66% | -1.1 |
| Construction | 5% | 4% | 5% | 3% | 0.2 |
| Manufacturing | 24% | 8% | 8% | -67% | -22.3 |
| Services-providing, excluding special industries | 54% | 80% | 80% | 49% | 37.4 |
| Wholesale trade | 4% | 4% | 4% | -9% | -0.5 |
| Retail trade | 9% | 10% | 10% | 14% | 1.6 |
| Transportation and warehousing | 4% | 3% | 4% | 3% | 0.1 |
| Information | 3% | 2% | 2% | -32% | -1.2 |
| Financial activities | 4% | 5% | 6% | 47% | 2.6 |
| Professional and business services | 6% | 12% | 13% | 133% | 10.7 |
| Educational and Health | 5% | 13% | 14% | 210% | 13.4 |
| Leisure and hospitality | 5% | 9% | 9% | 65% | 4.9 |
| Other services | 2% | 4% | 4% | 122% | 3.0 |
| Federal government | 4% | 2% | 2% | -48% | -2.5 |
| State and local government | 9% | 14% | 12% | 33% | 4.4 |
| Non-Wage (self-employed and other) | 9% | 6% | 5% | -39% | -4.8 |
Table Notes
* Jobs lost/gained if employment distribution was unchanged from 1960. Total US Employment was around 150 million in 2020. This measure is only a baseline for comparison.
All data except agriculture are from the BLS series. Agriculture is from OECD data.
Transportation and warehousing 1960 is estimated from 1972 data. Agricultural employment is even lower using full time equivalent employment since a lot of it is seasonal.
This shift in employment agrees with the common perception that geographic areas with heavy concentrations of manufacturing have been hit badly by employment declines over the last 60 years. Similarly, the 9.5 million fewer jobs in agriculture helps explain why many rural areas face declining populations.
Note that since the total population has gone up, a decline in the percentage of workers in a sector does not necessarily mean there are now fewer workers in that sector. However, the actual number of workers in both the goods producing and agriculture sectors is now lower than in 1960. It is also interesting to note that the percentage distributions haven’t changed much between 2010 and 2022. This suggests that for now whatever was causing these shifts between the major sectors has abated in the last decade.
What explains the decline in agricultural and manufacturing employment relative to services? There are three main drivers possible: differential productivity increases, international trade, and a change in demand from goods to services. One reasonable hypothesis would be that continued productivity improvements in agriculture and manufacturing have driven down the amount of labor required to produce the quantities of output that the market, including the export market, demands. Since less labor is required to grow food and produce goods, labor has flowed to service sectors such as education, health, and professional services. A second hypothesis would be that merchandise imports, trade, has reduced employment in manufacturing and that slack has been taken up by employment in services. Finally, we could imagine that as the price of goods declines relative to incomes, people find they’d rather spend money on services than more “stuff”. In fact, if necessary, services such as healthcare and housing become more expensive relative to goods, people might have to spend more money on services.
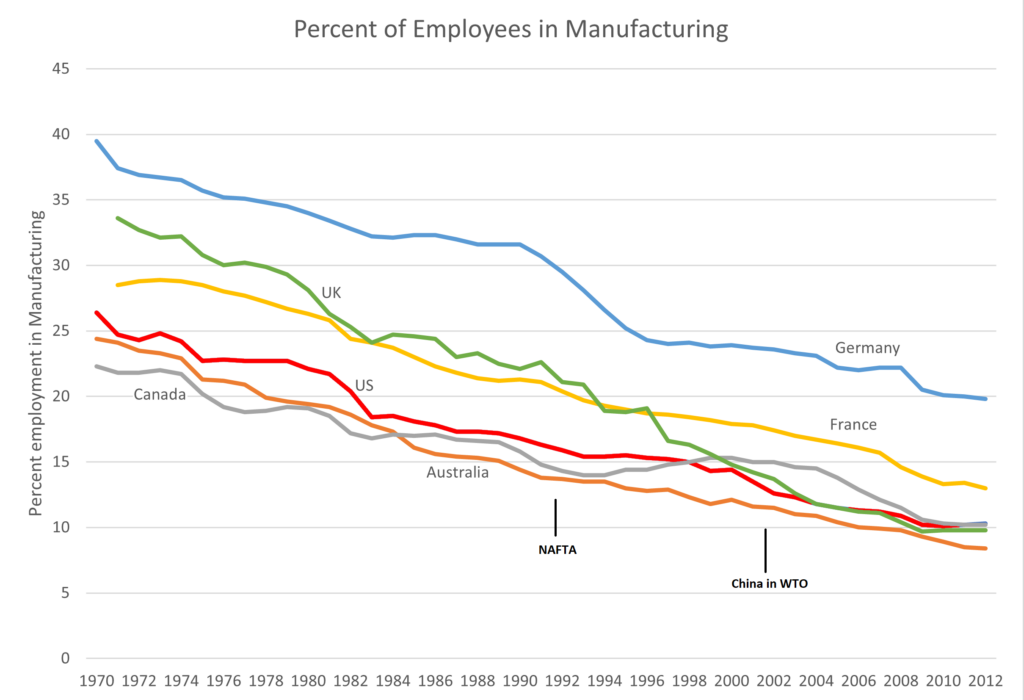
What has happened in the US is a combination of all three. And the story in the other advanced economies is similar. Here for example is the change in percentage of employment in manufacturing for a sample of advanced economies:

Figure 9: Percent of Employees in Manufacturing, Advanced Economies. Source: International Comparisons of Annual Labor Force Statistics, 1970-2012 Bureau of Labor Statistics WW102
Note that the percent of workers in manufacturing has declined in high income countries even when, like Germany, they run large trade surpluses. A lot of what’s happened in the US is applicable to other high-income countries as well.
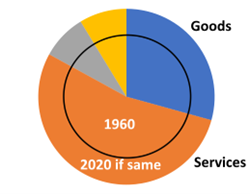
Before we dive into each of the major sectors of the economy let’s look at what the effect would be on our pie chart of the three types of changes we just mentioned: differential productivity increases, trade, and lower demand for goods compared to services.

The graph on the left is our percentages of employment in 1960 again. If there had only been productivity increases, and these increases had been the same in all sectors, then in 2020, the pie would have gotten bigger, but the slices would have been the same relative size as shown.
On the other hand, if productivity increased faster in goods producing (the blue wedge) than in services (the pumpkin wedge), then the goods producing employment slice would get smaller relative to the services employment slice as we saw in the actual data shown in the employment pie charts above[2]. But the same thing could occur if there was an excess of goods imports relative to exports, then the domestic goods producing sector would also not have grown as much and its slice of the pie would get smaller. Finally, if demand had shifted to favor services over goods, then the goods slice would have become smaller as well. The dramatic shift from goods producing to services in the advanced economy countries has been termed “deindustrialization”, and all three factors mentioned above have played a part. However, , as we’ll see later, there is general agreement that increased labor productivity in manufacturing is responsible for most of the employment shift from goods production to services.
[1] There are methodological issues with the way the value of output is measured that suggest that the actual output of manufacturing is now a smaller part of GDP. See Baily2014-mf. Employment numbers are from BLS series data.
[2] As mentioned before, increased productivity would result in lower relative prices which would increase demand. The demand increase would somewhat offset the job losses resulting from increased productivity. We are assuming that the increase in employment due to increased demand would be less than the loss of jobs due to the productivity increases.
