In a free-market buyers looking for a product, be it a bushel of corn or an industrial robot, shop around for the best combination of price, features, and quality. If there are many suppliers of the same product, the supplier must sell at the same price as the others. This is the “market price”, which is the price buyers are willing to pay for the item. But what if the buyers don’t want to pay the price the suppliers want? The actual price at which buyers and sellers get together is determined by what economists call the “law of supply and demand”. The best way to illustrate it is through diagrams. Let’s start with the buyer side of things.
The Relationship of Demand to Price
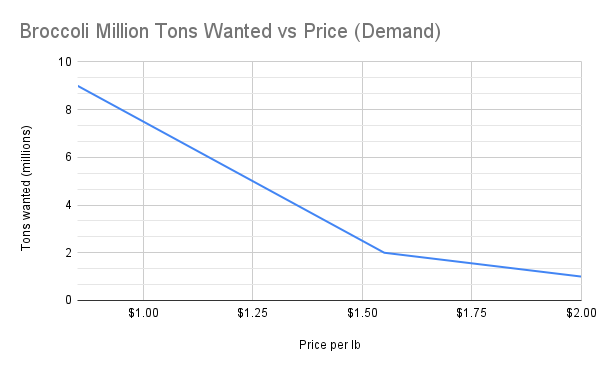
Let’s suppose you’ve gone to the store and are considering buying broccoli. Your decision is going to be influenced by how much you want the broccoli[1] and how much it costs. If it costs a lot, you might buy less of it or not buy it at all. Someone else who really likes broccoli might be willing to pay more for it than you would. Adding up how much broccoli everyone will buy at any specific price gives the “demand curve” for broccoli which might look something like this:

In this chart we see that if the price of broccoli is $1.25 per pound, people would buy about 5 million tons of the stuff.
The demand curves for different products have different shapes. For some products, such as broccoli, there are many other vegetables one can buy, so demand for broccoli is sensitive to price. Other products, such as gasoline, don’t have alternatives in the short run. If you want to drive your car, you need to buy gasoline. So, the short-term demand curve for gasoline slopes down only slightly. Again, some people with limited budgets will have a more downward sloping demand curve: as prices go up, they will have to cut back on driving. Rich folk will probably not cut back much or at all.
The demand curve relates the price of an item to how much of it gets sold. The actual price at which a product is sold, broccoli in this case, and the quantity of it produced depends on another curve, the supply curve.
The Relationship of Supply to Price
The amount of a good or service produced also depends on price. Clearly if the market price is less than the cost of production, suppliers will stop producing the item and the quantity available will drop. Eventually the quantity will become low enough that a shortage is created, and buyers will have to pay more. If, on the other hand, the price of the item is higher than the cost of production plus a reasonable profit, suppliers will increase output (or new suppliers will jump in) causing the price to drop.
It should be noted that short run supply curves are fairly flat: it takes time to ramp up production. Historically this was an issue in farming. Good prices this year caused farmers to grow more the next year causing a glut and lower, sometimes disastrously lower, prices the next year.[2]
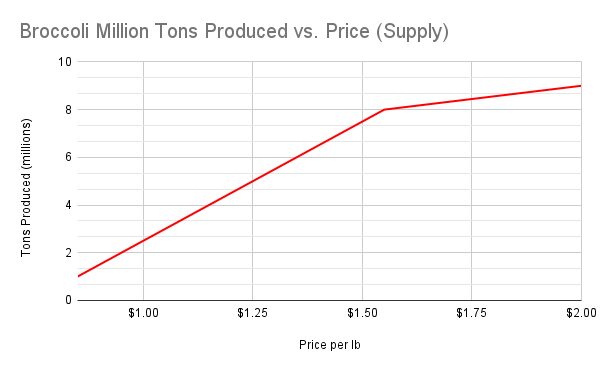
Let us take a look at a hypothetical long term supply curve for broccoli:

Here we see that farmers will grow more broccoli as the market price increases. Some farmers will have fields and climates that are particularly suited to growing broccoli and their cost to produce it will be low. As the price goes up, other farmers with less productive fields will be able to cover their costs of production profitably and will turn to growing broccoli. Most supply curves tilt upward like this.[3]
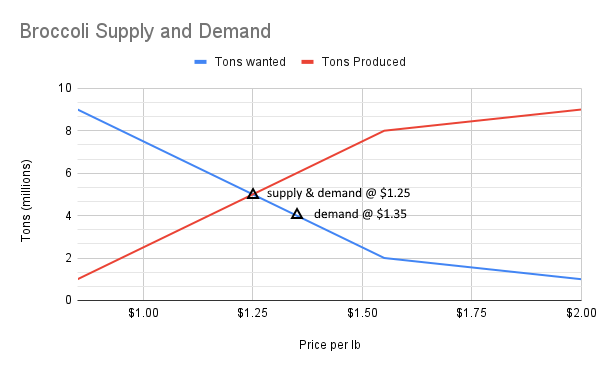
How do we know what the supply and demand curves for a particular commodity are? We find that out from actual experience. If Broccoli costs so much, so much of it is sold (this is demand at that price) and so much of it is produced (supply at that price). Let’s plot both demand and supply curves on the same chart:

When we plot both curves together, we see that the amount of broccoli people want to buy exactly matches the amount (in the long term) that suppliers will produce when the price is $1.25 per pound. At that price producers will grow, and consumers will buy, 5 million tons of broccoli. If farmers grow less than that amount, then the supply will be less than 5 million tons. Due to the lower supply, there will be an excess of demand over supply, and prices will rise. Farmers will be able to raise prices until demand is reduced and supply and demand meet again. For example, if supply drops to 4 million tons (say due to a drought), prices will go up to around $1.35 as shown because enough people will be willing to pay the higher price. At $1.35 demand will equal supply. This new higher price of $1.35 will encourage farmers to grow more broccoli the next year which will cause prices to drop. Eventually, over time, the equilibrium price and quantity of $1.25 is approached[4].
Note that this balancing of supply to meet demand, given production costs, is automatic in an ideal free market economy and is achieved through market pricing. A recent example is the shortage of face masks at the beginning of the COVID epidemic. The price of masks went sky high as demand greatly exceeded supply. This caused a large increase in mask manufacturing over time, and a consequent lowering of prices. As this example shows, it takes a while for supply to catch up with changes in demand. In this case the demand curve went up at all prices, and supply increased over time as manufacturers ramped up production.
There are many products and services and for each there is a demand curve. These demand curves reflect the aggregate preferences of consumers: so much for broccoli, so much for premium TV channels. For each item an ideal market adjusts supply and prices in such a way that they reflect the relative amounts of each item that people in the aggregate want given their budgets and the actual cost of producing the item. Adam Smith famously referred to this as the “invisible hand of the market”. Economists now also have another way of putting it: they say it “maximizes utility”. We’ll discuss that more later, but it is worth noting that aggregate demand curves don’t necessarily reflect yours or mine. We might not have much use for super yachts, but there is a demand curve for them.[5]
A Note on the Shape and Shifts of Demand and Supply Curves
Demand and supply curves are mostly common-sense conceptual aids for understanding how an ideal free market works. The downward sloping nature of the demand curve is intuitive: as prices go up, demand goes down, and many observations support this general conclusion[6]. As mentioned above some items are more “price sensitive” than others, so the downward slope is steeper for some products than others. As the population grows, overall demand for any product or service will grow with it, but the shape of the demand curve isn’t necessarily changed: if you are a factory owner you might predict a 10% growth in demand from a 10% growth in population. Overall demand and the shape of the demand curve can shift over time due to changes in tastes, technological changes (e.g. demand for horses as cars were adopted), and changes in income distribution, among other factors. Demand can change rapidly due to a shock such as the COVID pandemic, but usually changes fairly slowly, so short term prices tend to be pretty stable.
Similarly, supply is usually pretty much fixed in the short term. In our broccoli example it takes time to grow a new crop, say a year. The short-term supply curve is essentially flat: the quantity is fixed regardless of price and only demand can change. Longer term supply will change in response to demand as more farmers plant broccoli or more cars are produced at existing factories or more car factories are built. Costs of an item can also change in response to changes in the costs of the materials or labor used to make it.
Finally, technological changes have a major impact on the cost of goods and services.
Famously, before Henry Ford introduced the assembly line to build model T Ford cars, cars were hand built and very expensive. Ford saw that there was an enormous demand for cars and that he could build them less expensively in quantity. The industrial revolutions (there were several) greatly reduced the cost of producing many goods, and computerized automation, sometimes called the 4th industrial revolution, and machine learning, continue the trend today.
[1] In economics “how much you want something” is called its “utility” to you. Since you have a given income, you will balance how much you buy of anything so that you are not giving up even more “utility” by not using that money to buy something else. By your balancing act you are assumed to “maximize your utility” given your preferences and income. Your demand for any item at a given price reveals how important it is to you (its utility to you).
[2] Various farm programs were developed to address the problem of agricultural overproduction including incentives for farmers to take land out of production in some cases.
[3] There are exceptions of course. For example, some sections of a demand curve may tilt down due to economies of scale: making things in large quantities can lower the cost of production.
[4] With many producers and imperfect information, the match between supply and demand is actually not so precise. In agriculture, there can be fluctuations due to droughts for example. Also, if the price one year is high, farmers may grow too much of it the next, overshooting the equilibrium point. Governments sometimes have bought excess crops or paid farmers not to produce to try to smooth such curves in agriculture in particular.
[5] Similarly, “utility maximization” takes incomes as a given and looks at how the market maximizes it under that constraint. More on that in part 3.
[6] There are a handful of documented cases in which decreasing prices for a commodity caused a decrease in demand. These are referred to as “Giffen goods”.
